
📊 **BTC Cycle Analysis (Aug 2025)**
🔎 **Observations from the chart**
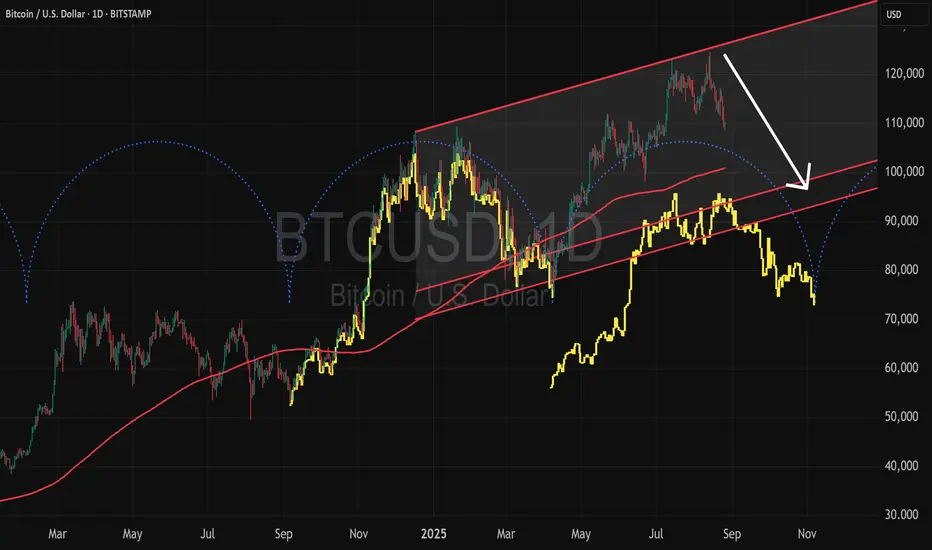
* **Blue arcs (Cycle Projection):** Indicate potential cycle lows. Each cycle spans roughly **4–5 months**.
* **Yellow overlay (Historical Pattern):** Previous price behavior mapped onto the current cycle, showing a similar rhythm.
* **Rising channel (Red lines):** BTC remains in a long-term uptrend channel, but is currently pulling back toward the lower boundary.
* **White arrow (Projection):** Price could correct down to the **\$95K–\$100K** zone, which aligns with both the MA and channel support.
🌀 **Cycle Outlook**
* BTC is now in the **mid-to-late stage of the current cycle**. The next cycle low is projected around **Oct–Nov 2025**.
* Historically, each cycle showed **strong rallies followed by deep corrections**, suggesting this cycle may also experience a notable pullback.
* Key supports: **\$95K** and **\$85K** (if the channel breaks).
📈 **Strategy Based on Cycle Analysis**
* **Short-term traders:** Be cautious of further downside pressure until the cycle bottom forms. Attractive entry zones = near **\$95K** or, if broken, **\$85K**.
* **Medium/long-term investors:** Use upcoming cycle lows as **accumulation points (DCA)**. As long as price holds within the channel, the broader trend remains bullish.
* **Risk signal:** A confirmed **daily close below \$85K** could invalidate the bullish cycle structure and shift outlook to a **longer correction phase**.
🔎 **Observations from the chart**
* **Blue arcs (Cycle Projection):** Indicate potential cycle lows. Each cycle spans roughly **4–5 months**.
* **Yellow overlay (Historical Pattern):** Previous price behavior mapped onto the current cycle, showing a similar rhythm.
* **Rising channel (Red lines):** BTC remains in a long-term uptrend channel, but is currently pulling back toward the lower boundary.
* **White arrow (Projection):** Price could correct down to the **\$95K–\$100K** zone, which aligns with both the MA and channel support.
🌀 **Cycle Outlook**
* BTC is now in the **mid-to-late stage of the current cycle**. The next cycle low is projected around **Oct–Nov 2025**.
* Historically, each cycle showed **strong rallies followed by deep corrections**, suggesting this cycle may also experience a notable pullback.
* Key supports: **\$95K** and **\$85K** (if the channel breaks).
📈 **Strategy Based on Cycle Analysis**
* **Short-term traders:** Be cautious of further downside pressure until the cycle bottom forms. Attractive entry zones = near **\$95K** or, if broken, **\$85K**.
* **Medium/long-term investors:** Use upcoming cycle lows as **accumulation points (DCA)**. As long as price holds within the channel, the broader trend remains bullish.
* **Risk signal:** A confirmed **daily close below \$85K** could invalidate the bullish cycle structure and shift outlook to a **longer correction phase**.

Feragatname
Bilgiler ve yayınlar, TradingView tarafından sağlanan veya onaylanan finansal, yatırım, alım satım veya diğer türden tavsiye veya öneriler anlamına gelmez ve teşkil etmez. Kullanım Koşulları bölümünde daha fazlasını okuyun.
Feragatname
Bilgiler ve yayınlar, TradingView tarafından sağlanan veya onaylanan finansal, yatırım, alım satım veya diğer türden tavsiye veya öneriler anlamına gelmez ve teşkil etmez. Kullanım Koşulları bölümünde daha fazlasını okuyun.