
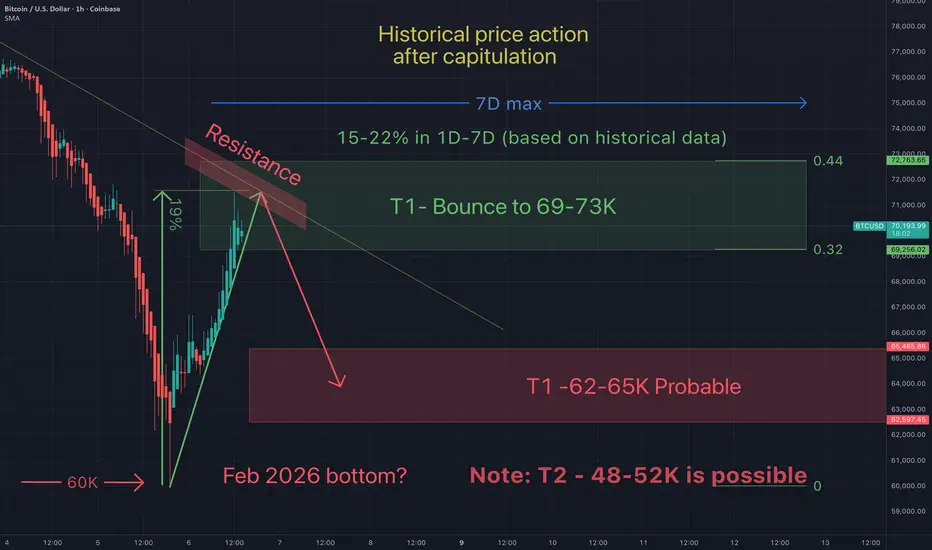
Here is more granular look at price action. This is a copy of the 1 Day time frame chart I posted earlier today. But now I'm looking at the hourly now because Btc is moving faster then normal through this historical pattern. This crash from the high, has been one of the fastest moving crashes (through each of the signifiacnt moving averages). Faster then any other cycle.
Same pattern, different velocity, so it may look different then other cycles, but my expectation is the same. Btc is bottoming either at yesterdays low of $60K or possibly swipe the lows down to $48K-$50K (my money is on this lower low).
May the trends be with you.
Same pattern, different velocity, so it may look different then other cycles, but my expectation is the same. Btc is bottoming either at yesterdays low of $60K or possibly swipe the lows down to $48K-$50K (my money is on this lower low).
May the trends be with you.

May the trends be with you.
Feragatname
Bilgiler ve yayınlar, TradingView tarafından sağlanan veya onaylanan finansal, yatırım, alım satım veya diğer türden tavsiye veya öneriler anlamına gelmez ve teşkil etmez. Kullanım Koşulları bölümünde daha fazlasını okuyun.
May the trends be with you.
Feragatname
Bilgiler ve yayınlar, TradingView tarafından sağlanan veya onaylanan finansal, yatırım, alım satım veya diğer türden tavsiye veya öneriler anlamına gelmez ve teşkil etmez. Kullanım Koşulları bölümünde daha fazlasını okuyun.