
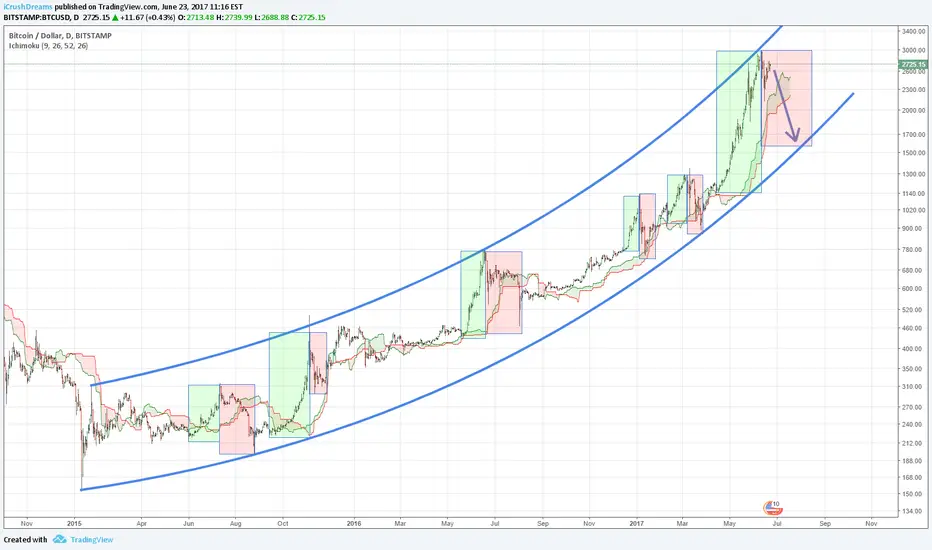
Bitcoin has been respecting the same trend line on logarithmic scale ever since the 2013 crash. Since then, there have been plenty of bubbles that start in the bottom half of the trend line and bounce off of the top half of the trend line. The one starting in April is no different. It bounced perfectly off of the top of the logarithmic trend line and is experiencing a bull trap as it has a few times in the past.
Assuming this time is no different than any of the past patterns in the last 2-3 years, we should see a correction to the $1400-$1550 range.
Happy trading!
Assuming this time is no different than any of the past patterns in the last 2-3 years, we should see a correction to the $1400-$1550 range.
Happy trading!
Not
Doom kicking in. Start closing your shorts in the medium-high 1000s. I'd say start at 1850 and aim to be completely out by 1600. Just in case it doesn't fall that far you can still close a bit higher.
Feragatname
Bilgiler ve yayınlar, TradingView tarafından sağlanan veya onaylanan finansal, yatırım, alım satım veya diğer türden tavsiye veya öneriler anlamına gelmez ve teşkil etmez. Kullanım Koşulları bölümünde daha fazlasını okuyun.
Feragatname
Bilgiler ve yayınlar, TradingView tarafından sağlanan veya onaylanan finansal, yatırım, alım satım veya diğer türden tavsiye veya öneriler anlamına gelmez ve teşkil etmez. Kullanım Koşulları bölümünde daha fazlasını okuyun.