
Crypto Analysis (Spot) | The Professor X
Pair: BTC/USDT 🌍
Timeframe: 1day (Main) + 4H (Confirmation) — Manual 📊
Date & Time: 16/07/2026 — 21:11 (CET) 🕒
🧭 Market Outlook:
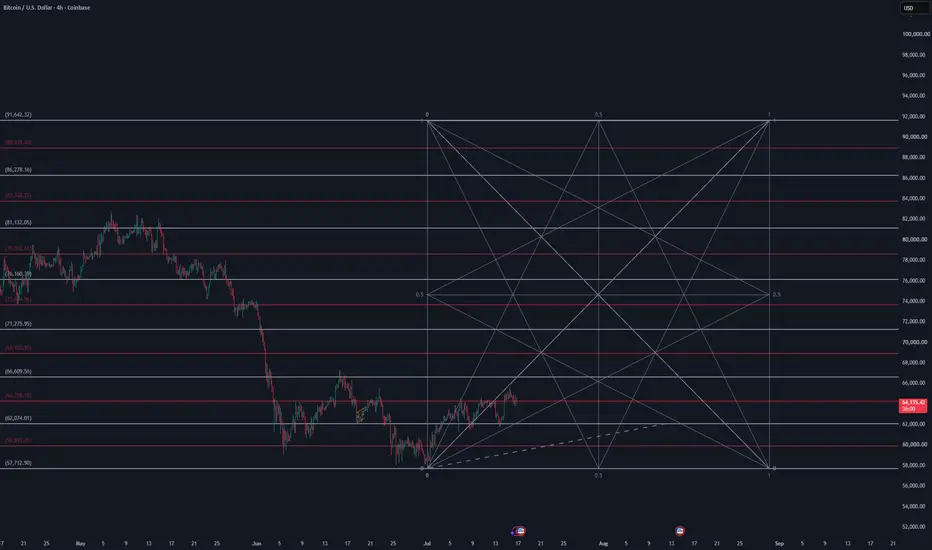
Price is currently forming a new time bottom after a strong downward wave, marking the start of a bullish time cycle according to the Gann Time Cycle model shown on the chart. There is a clear bounce from a major bottom, and price is moving above an ascending trendline drawn from the recent low.
🎯 Confidence Level: 58%
📚 Analysis Methodology: Time Cycle Analysis — Based on Gann time lines and cycle intervals, monitoring the start of a new bullish cycle from the recent bottom.
🗺️ Key Order Flow Zones:
🟢 Nearest Support (Buy Wall): 64280.6
🔴 Nearest Resistance (Sell Wall): 64280.6
🔄 Most Likely Reversal Zone: Support at 64280.6 is the closest to the current price and is likely to be a strong bounce point due to its alignment with the start of the bullish time cycle.
💼 Trade Details:
🔍 Current Price: 64280.62 (Binance)
✅ Trade Type: Buy
📍 Entry: 64280.62
🎯 Target 1: 74200 (+15.4%)
🎯 Target 2: 82000 (+27.6%)
⚠️ Danger Zone / Re-entry (SL): 59800 (-7.0%)
🧠 Reasoning:
Time Cycle Analysis indicates the beginning of a new bullish cycle from a clear bottom, with price action aligning with Gann time lines. Price is trading above an ascending trendline, and there is a strong bounce from a major support area. Order flow shows a balance with a slight bullish bias, supporting a gradual upward scenario over the coming weeks. Targets were determined based on Gann time levels and historical resistances.
Disclaimer: This analysis is for informational purposes only and represents a personal point of view; it is not financial or investment advice. I am not responsible for any investment decisions or trades made based on this content. Trading in financial markets involves high risk; please always perform your own due diligence before making any decisions.

Pair: BTC/USDT 🌍
Timeframe: 1day (Main) + 4H (Confirmation) — Manual 📊
Date & Time: 16/07/2026 — 21:11 (CET) 🕒
🧭 Market Outlook:
Price is currently forming a new time bottom after a strong downward wave, marking the start of a bullish time cycle according to the Gann Time Cycle model shown on the chart. There is a clear bounce from a major bottom, and price is moving above an ascending trendline drawn from the recent low.
🎯 Confidence Level: 58%
📚 Analysis Methodology: Time Cycle Analysis — Based on Gann time lines and cycle intervals, monitoring the start of a new bullish cycle from the recent bottom.
🗺️ Key Order Flow Zones:
🟢 Nearest Support (Buy Wall): 64280.6
🔴 Nearest Resistance (Sell Wall): 64280.6
🔄 Most Likely Reversal Zone: Support at 64280.6 is the closest to the current price and is likely to be a strong bounce point due to its alignment with the start of the bullish time cycle.
💼 Trade Details:
🔍 Current Price: 64280.62 (Binance)
✅ Trade Type: Buy
📍 Entry: 64280.62
🎯 Target 1: 74200 (+15.4%)
🎯 Target 2: 82000 (+27.6%)
⚠️ Danger Zone / Re-entry (SL): 59800 (-7.0%)
🧠 Reasoning:
Time Cycle Analysis indicates the beginning of a new bullish cycle from a clear bottom, with price action aligning with Gann time lines. Price is trading above an ascending trendline, and there is a strong bounce from a major support area. Order flow shows a balance with a slight bullish bias, supporting a gradual upward scenario over the coming weeks. Targets were determined based on Gann time levels and historical resistances.
Disclaimer: This analysis is for informational purposes only and represents a personal point of view; it is not financial or investment advice. I am not responsible for any investment decisions or trades made based on this content. Trading in financial markets involves high risk; please always perform your own due diligence before making any decisions.

هوزان طاهر: مبرمج ومتداول خبير (6+ سنوات). متخصص في التحليل الفني (إليوت، SMC، وايكوف، التحليل الزمني) واستراتيجيات التداول (Alpha). أقدم تدريبًا وأطور روبوتات تداول ذكية. (للتواصل، انظر روابط الملف الشخصي)
Feragatname
Bilgiler ve yayınlar, TradingView tarafından sağlanan veya onaylanan finansal, yatırım, alım satım veya diğer türden tavsiye veya öneriler anlamına gelmez ve teşkil etmez. Kullanım Koşulları bölümünde daha fazlasını okuyun.
هوزان طاهر: مبرمج ومتداول خبير (6+ سنوات). متخصص في التحليل الفني (إليوت، SMC، وايكوف، التحليل الزمني) واستراتيجيات التداول (Alpha). أقدم تدريبًا وأطور روبوتات تداول ذكية. (للتواصل، انظر روابط الملف الشخصي)
Feragatname
Bilgiler ve yayınlar, TradingView tarafından sağlanan veya onaylanan finansal, yatırım, alım satım veya diğer türden tavsiye veya öneriler anlamına gelmez ve teşkil etmez. Kullanım Koşulları bölümünde daha fazlasını okuyun.