
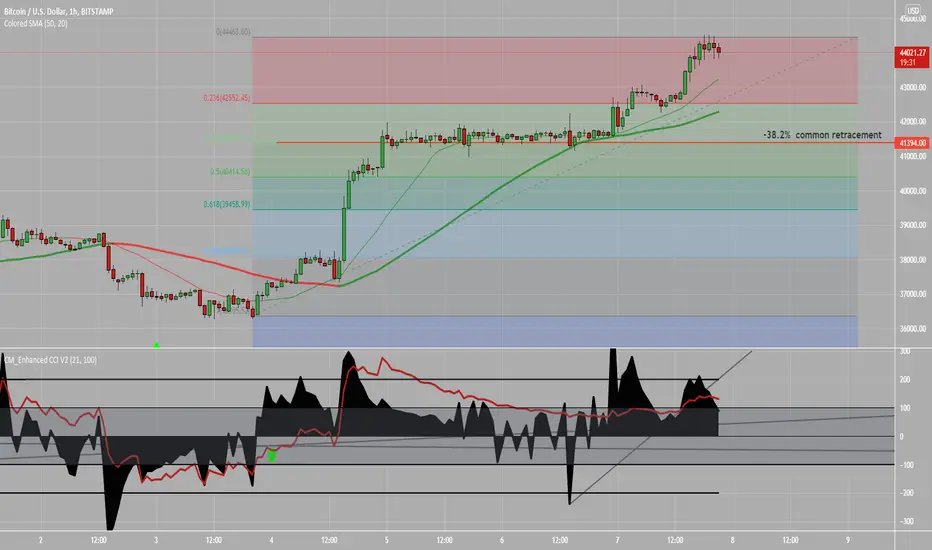
Here's an hourly chart recommended on the previous Daily chart post for scalping of a likely pullback. As explained there, we were looking on H1 chart for a break of 13CCI down thru an uptrendline, shown here on chart, from 44315.
Resumption of Up trend would be a cross of CCI back up thru a down trendline on CCI, after tagging -38.2% retracement
Resumption of Up trend would be a cross of CCI back up thru a down trendline on CCI, after tagging -38.2% retracement
Not
It's reasonable to stay w Daily charts if you don't want to trade oftenNot
sorry I didnt wait for a 5th waveup to 45625 before locating -38.2%.

Feragatname
Bilgiler ve yayınlar, TradingView tarafından sağlanan veya onaylanan finansal, yatırım, alım satım veya diğer türden tavsiye veya öneriler anlamına gelmez ve teşkil etmez. Kullanım Koşulları bölümünde daha fazlasını okuyun.
Feragatname
Bilgiler ve yayınlar, TradingView tarafından sağlanan veya onaylanan finansal, yatırım, alım satım veya diğer türden tavsiye veya öneriler anlamına gelmez ve teşkil etmez. Kullanım Koşulları bölümünde daha fazlasını okuyun.