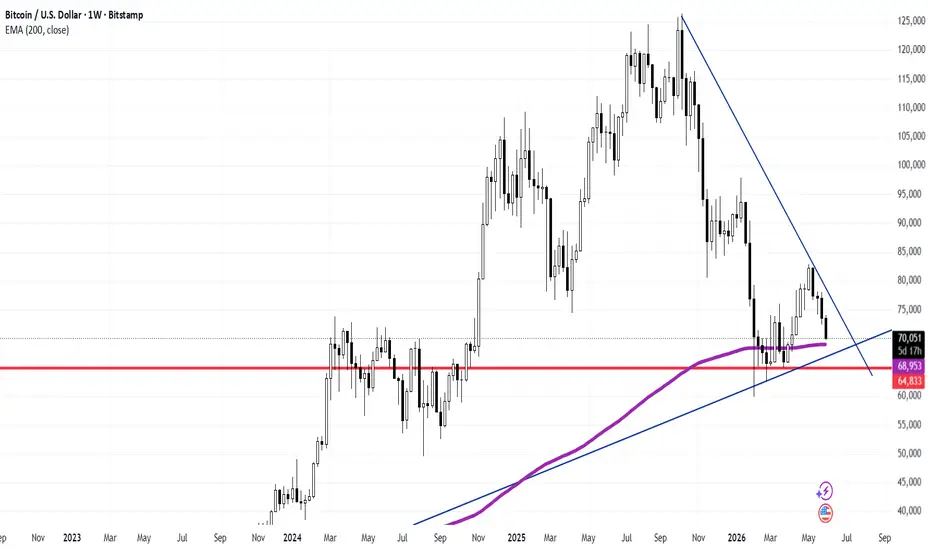
Bitcoin ( BTCUSD - Bitstamp) is presenting an incredibly significant macro structural test on the Weekly (1W) chart. As long-term technical analysts, this is the exact type of high-probability confluence block we monitor for primary trend definitions.
Following a prolonged corrective cycle from its macro peaks, price action has compressed into a critical multi-layered demand territory.
### Key Macro Technical Factors:
* **The Weekly 200 EMA Baseline (68,953):** The dynamic purple baseline represents the 200-period Exponential Moving Average on the weekly timeframe, currently tracking at **68,953**. Historically, the Weekly 200 EMA serves as one of the most respected institutional floors in Bitcoin's history, acting as a definitive boundary between macro regimes.
* **The Horizontal Support Floor (64,833):** Directly beneath the dynamic average lies the vital structural support wall marked by the horizontal red line at **64,833**. This area represents a major historical liquidity pocket where long-term buyers have historically defended aggressive distribution.
* **The Trendline Compression Squeeze:** Price action is entering the final apex of a massive structural triangle, squeezed between the dominant descending macro trendline (upper blue LTB) and the primary ascending trendline (lower blue LTA).
### Strategic Outlook & Market Implications:
The intersection of the Weekly 200 EMA, the horizontal demand wall at 64,833, and the multi-month trendlines creates an exceptionally strong technical cluster.
* **The Bullish Defense Setup:** Because this zone represents deep institutional value, a clean weekly close showing deceleration (such as long lower rejection wicks or a bullish engulfing pattern) will confirm that the smart money is absorbing the supply, establishing a solid launchpad for the next macro expansion leg.
* **Risk Management Caution:** Conversely, any decisive weekly candle acceptance below the 64,833 support floor would invalidate this immediate accumulation thesis, opening the path for a deeper structural correction.
### Professional Execution Plan:
Chasing short positions directly into a rising weekly 200 EMA and historical horizontal support carries a highly unfavourable risk-to-reward ratio. The professional playbook requires monitoring lower timeframe structures (Daily or H4) inside this current high-value cluster, waiting for verified accumulation patterns or structural shifts (CHoCH) to position alongside primary institutional order flow.
---
📊 **ProData Chart** | By Rogerio Zaglia
*Macro Technical Analysis & Global Asset Research.*
⚠️ **Disclaimer:** For educational and informational purposes only. This study does not constitute financial advice or an investment recommendation. Past performance is not indicative of future results.
BTCUSD - Bitstamp) is presenting an incredibly significant macro structural test on the Weekly (1W) chart. As long-term technical analysts, this is the exact type of high-probability confluence block we monitor for primary trend definitions.Following a prolonged corrective cycle from its macro peaks, price action has compressed into a critical multi-layered demand territory.
### Key Macro Technical Factors:
* **The Weekly 200 EMA Baseline (68,953):** The dynamic purple baseline represents the 200-period Exponential Moving Average on the weekly timeframe, currently tracking at **68,953**. Historically, the Weekly 200 EMA serves as one of the most respected institutional floors in Bitcoin's history, acting as a definitive boundary between macro regimes.
* **The Horizontal Support Floor (64,833):** Directly beneath the dynamic average lies the vital structural support wall marked by the horizontal red line at **64,833**. This area represents a major historical liquidity pocket where long-term buyers have historically defended aggressive distribution.
* **The Trendline Compression Squeeze:** Price action is entering the final apex of a massive structural triangle, squeezed between the dominant descending macro trendline (upper blue LTB) and the primary ascending trendline (lower blue LTA).
### Strategic Outlook & Market Implications:
The intersection of the Weekly 200 EMA, the horizontal demand wall at 64,833, and the multi-month trendlines creates an exceptionally strong technical cluster.
* **The Bullish Defense Setup:** Because this zone represents deep institutional value, a clean weekly close showing deceleration (such as long lower rejection wicks or a bullish engulfing pattern) will confirm that the smart money is absorbing the supply, establishing a solid launchpad for the next macro expansion leg.
* **Risk Management Caution:** Conversely, any decisive weekly candle acceptance below the 64,833 support floor would invalidate this immediate accumulation thesis, opening the path for a deeper structural correction.
### Professional Execution Plan:
Chasing short positions directly into a rising weekly 200 EMA and historical horizontal support carries a highly unfavourable risk-to-reward ratio. The professional playbook requires monitoring lower timeframe structures (Daily or H4) inside this current high-value cluster, waiting for verified accumulation patterns or structural shifts (CHoCH) to position alongside primary institutional order flow.
---
📊 **ProData Chart** | By Rogerio Zaglia
*Macro Technical Analysis & Global Asset Research.*
⚠️ **Disclaimer:** For educational and informational purposes only. This study does not constitute financial advice or an investment recommendation. Past performance is not indicative of future results.

Feragatname
Bilgiler ve yayınlar, TradingView tarafından sağlanan veya onaylanan finansal, yatırım, alım satım veya diğer türden tavsiye veya öneriler anlamına gelmez ve teşkil etmez. Kullanım Koşulları bölümünde daha fazlasını okuyun.
Feragatname
Bilgiler ve yayınlar, TradingView tarafından sağlanan veya onaylanan finansal, yatırım, alım satım veya diğer türden tavsiye veya öneriler anlamına gelmez ve teşkil etmez. Kullanım Koşulları bölümünde daha fazlasını okuyun.