
Technical Analysis and Outlook:
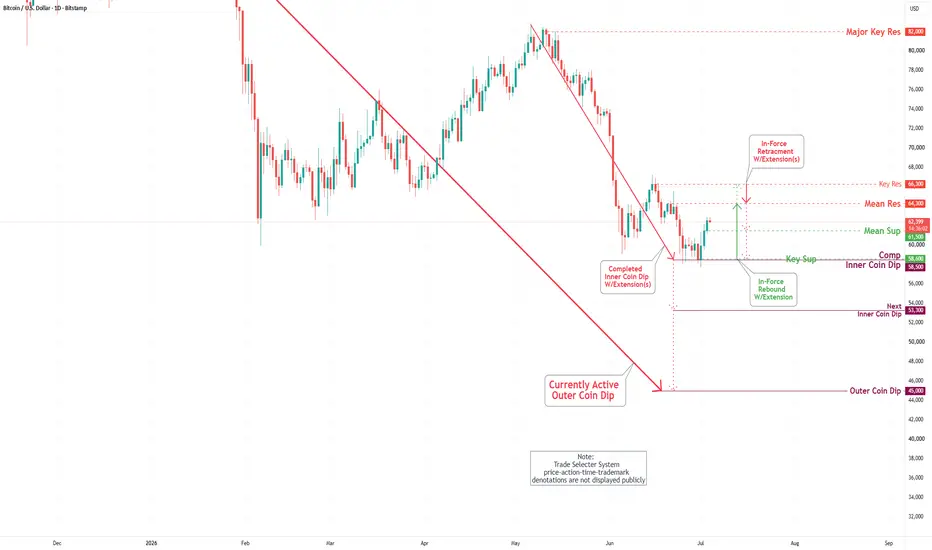
In the past week's trading session, Bitcoin has continued its upward trajectory after retesting the completed Inner Coin Dip at $58,500 and reaching the Mean Resistance at $61,800.
Currently, market analysis indicates a strong likelihood that Bitcoin will continue its ascent towards the Mean Resistance at $64,300, with the possibility of further progress reaching the upper target, the Key Resistance at $66,300.
Conversely, there is a risk that the cryptocurrency may experience an early reversal, retreating from the Mean Resistance at $64,300 to the Mean Support at $61,500. Such a decline could lead to a retest of the completed Inner Coin Dip at $58,500 and trigger an extension further to the subsequent Inner Coin Dip at $53,300, with the ultimate target being the Outer Coin Dip at $45,000.
In the past week's trading session, Bitcoin has continued its upward trajectory after retesting the completed Inner Coin Dip at $58,500 and reaching the Mean Resistance at $61,800.
Currently, market analysis indicates a strong likelihood that Bitcoin will continue its ascent towards the Mean Resistance at $64,300, with the possibility of further progress reaching the upper target, the Key Resistance at $66,300.
Conversely, there is a risk that the cryptocurrency may experience an early reversal, retreating from the Mean Resistance at $64,300 to the Mean Support at $61,500. Such a decline could lead to a retest of the completed Inner Coin Dip at $58,500 and trigger an extension further to the subsequent Inner Coin Dip at $53,300, with the ultimate target being the Outer Coin Dip at $45,000.

İlgili yayınlar
Feragatname
Bilgiler ve yayınlar, TradingView tarafından sağlanan veya onaylanan finansal, yatırım, alım satım veya diğer türden tavsiye veya öneriler anlamına gelmez ve teşkil etmez. Kullanım Koşulları bölümünde daha fazlasını okuyun.
Feragatname
Bilgiler ve yayınlar, TradingView tarafından sağlanan veya onaylanan finansal, yatırım, alım satım veya diğer türden tavsiye veya öneriler anlamına gelmez ve teşkil etmez. Kullanım Koşulları bölümünde daha fazlasını okuyun.