
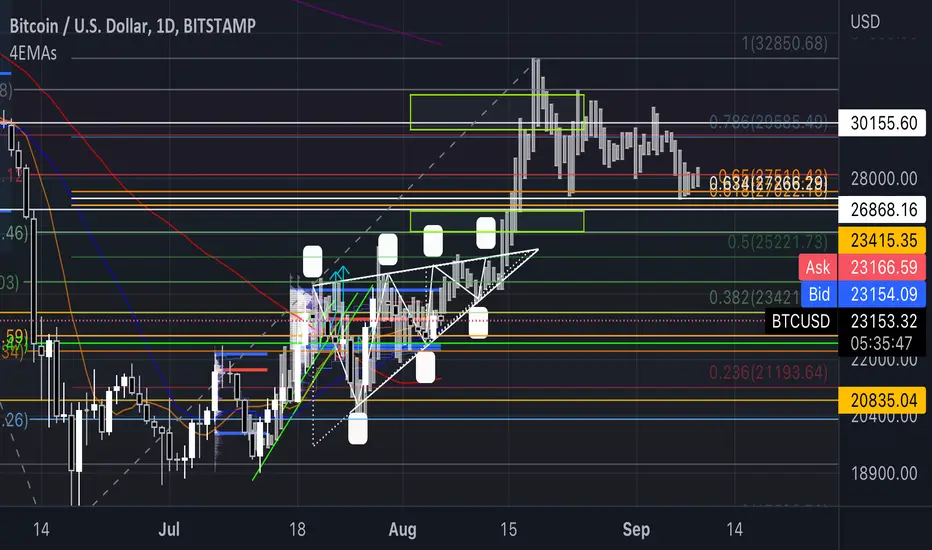
I’m just gonna leave this here. What you’re looking at is a bar pattern copy of a previous move bitcoin has made overlaid onto the current chart - One that just so happens to align nearly perfectly with the Fibonacci levels, from the last daily swing low, to the hypothetically soon-coming swing hight, which would put the upcoming 0.382 at around $23,421, the golden pocket $27,000-$27,500 range, the 0.786 at around $29,585 and the 1.0 at $32,850, peaking there, sometime around August 15th to August 18th.
Let me know what y’all think.
***I’m not a Financial advisor nothing I said is financial advice and you shouldn’t buy or sell anything just because I discussed it in this post. You, and you alone are responsible for your financial decisions and risk management.
Let me know what y’all think.
***I’m not a Financial advisor nothing I said is financial advice and you shouldn’t buy or sell anything just because I discussed it in this post. You, and you alone are responsible for your financial decisions and risk management.

Feragatname
Bilgiler ve yayınlar, TradingView tarafından sağlanan veya onaylanan finansal, yatırım, alım satım veya diğer türden tavsiye veya öneriler anlamına gelmez ve teşkil etmez. Kullanım Koşulları bölümünde daha fazlasını okuyun.
Feragatname
Bilgiler ve yayınlar, TradingView tarafından sağlanan veya onaylanan finansal, yatırım, alım satım veya diğer türden tavsiye veya öneriler anlamına gelmez ve teşkil etmez. Kullanım Koşulları bölümünde daha fazlasını okuyun.