
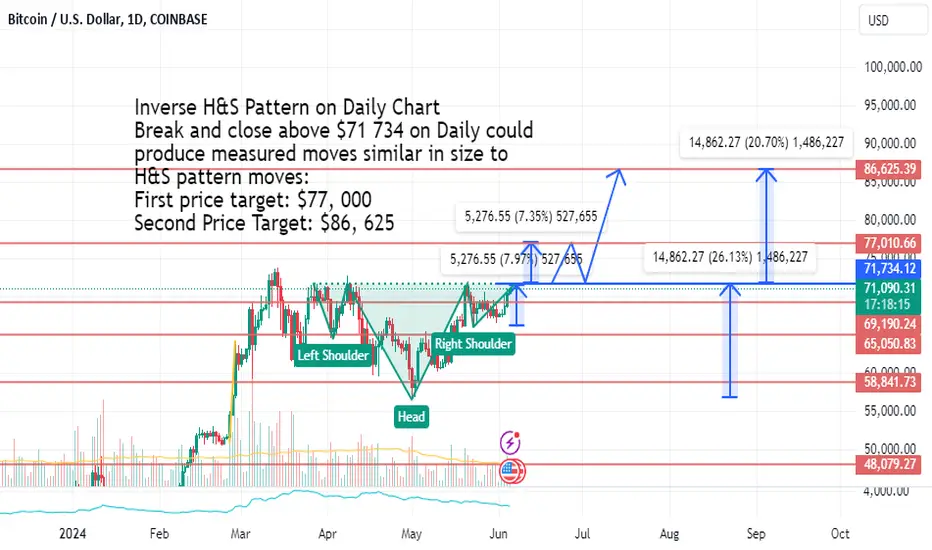
Inverse H&S Pattern is almost completely formed on the Daily Chart.
A Break and close above $71 734 on Daily chart could result in measured moves corresponding with the moves in the Inverse head and shoulder pattern. My prediction: if a Daily close above this level, then we'd see a break upwards to $FWB:77K, retrace back to neckline, and bounce up to $86, 625.
First price target: $77, 000
Second Price Target: $86, 625
Amateur pattern and technical analysis trader. NOT investment advice. Making these posts to document my own journey and thought processes/development on here.
A Break and close above $71 734 on Daily chart could result in measured moves corresponding with the moves in the Inverse head and shoulder pattern. My prediction: if a Daily close above this level, then we'd see a break upwards to $FWB:77K, retrace back to neckline, and bounce up to $86, 625.
First price target: $77, 000
Second Price Target: $86, 625
Amateur pattern and technical analysis trader. NOT investment advice. Making these posts to document my own journey and thought processes/development on here.

Feragatname
Bilgiler ve yayınlar, TradingView tarafından sağlanan veya onaylanan finansal, yatırım, alım satım veya diğer türden tavsiye veya öneriler anlamına gelmez ve teşkil etmez. Kullanım Koşulları bölümünde daha fazlasını okuyun.
Feragatname
Bilgiler ve yayınlar, TradingView tarafından sağlanan veya onaylanan finansal, yatırım, alım satım veya diğer türden tavsiye veya öneriler anlamına gelmez ve teşkil etmez. Kullanım Koşulları bölümünde daha fazlasını okuyun.