
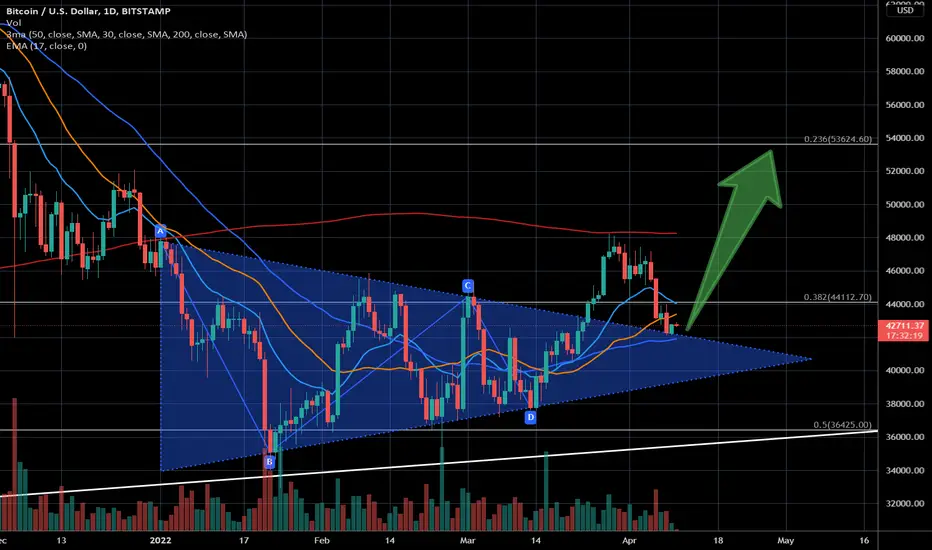
Looks like we can open the bullish case.
Could be a nice long setup. Valid on the daily and weekly timeframe. If the price drifts further down, I would see this setup invalidated.
- Triangle formation has broken to the upper side
- Re-Test of the triangle on the upside on Friday
- Price above still above the 50 SMA
- Short-term MAs are bullish aligned (17 EMA > 30 SMA > 50 SMA)
Could be a nice long setup. Valid on the daily and weekly timeframe. If the price drifts further down, I would see this setup invalidated.
Not
Unfortunately, the triangle didn't work. I've adjusted the shape now and see what we've got: A rising channel. But this could be considered also as a bearish flag. However from the current position it seems to be more likely that BTC is doing a bounce to the upside. But it's questionable if BTC can leave the channel ...Not
Looks like tomorrow we can see a pump in BTC - or a dump. ;) I'm expecting rather a pump, but could also be wrong ...
Not
Yesterday's assumption was wrong - it went south. But I've re-drawn the channel now because it has confirmed some significant points on the chart. The upward channel seems to be nevertheless still valid. Waiting for a bounce to the upside of this channel:
İlgili yayınlar
Feragatname
Bilgiler ve yayınlar, TradingView tarafından sağlanan veya onaylanan finansal, yatırım, alım satım veya diğer türden tavsiye veya öneriler anlamına gelmez ve teşkil etmez. Kullanım Koşulları bölümünde daha fazlasını okuyun.
İlgili yayınlar
Feragatname
Bilgiler ve yayınlar, TradingView tarafından sağlanan veya onaylanan finansal, yatırım, alım satım veya diğer türden tavsiye veya öneriler anlamına gelmez ve teşkil etmez. Kullanım Koşulları bölümünde daha fazlasını okuyun.