
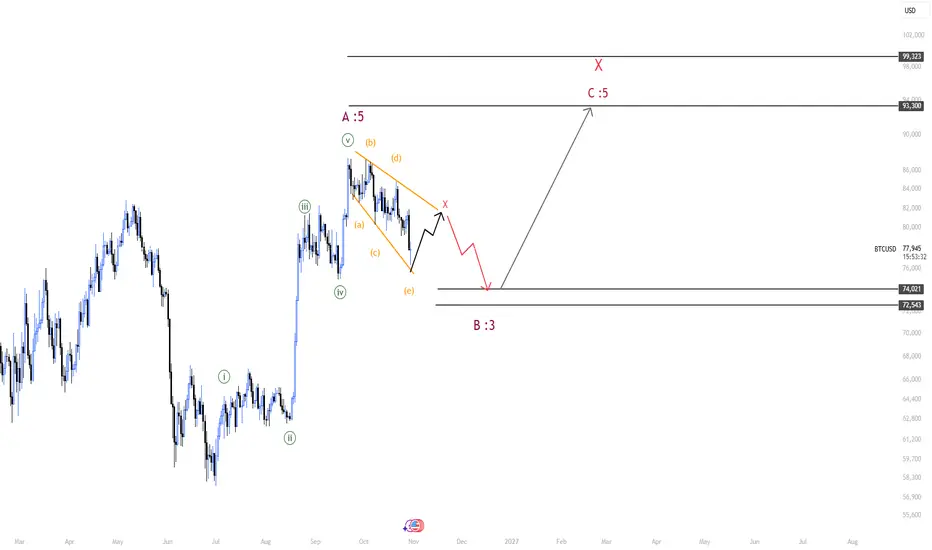
Following the July 1, 2026 low, Bitcoin appears to have developed a five-wave upward structure, potentially completing on September 21 near 87K.
This advance seems to exhibit the characteristics of an impulsive move. However, rather than marking the beginning of a new bullish trend, it may represent wave A of a larger corrective zigzag (A-B-C).
- Wave B: A Complex Correction in Progress
Bitcoin now appears to be developing wave B of the proposed zigzag.
The initial corrective structure seems to have taken the form of an expanding triangle (A-B-C-D-E), as illustrated on the chart.
If this interpretation is correct, the triangle could be followed by a short-term X-wave recovery before another corrective structure develops to complete the larger wave B.
Under this scenario, wave B could eventually terminate within the 72.5K–74K region.
- Wave C: A Potential Rally Toward 93K–95K
Once wave B is complete, Bitcoin could begin wave C, potentially unfolding as another five-wave impulsive advance.
This would suggest a possible rally toward the 93K–95K region, completing the proposed A-B-C zigzag.
- The Bigger Picture: A Bearish Continuation?
As discussed in my previous analysis, the broader market structure suggests that Bitcoin may still be developing a larger corrective X-wave.
The zigzag outlined here could represent the final stage of that X-wave.
If this interpretation proves correct, its completion may mark the end of the corrective recovery, with Bitcoin potentially resuming its broader decline toward the 50K region.
- Weekly Chart: Signs of Weakening Selling Pressure
On the weekly chart, volume analysis appears to indicate weakening seller dominance compared to the stronger selling pressure observed since October 6, 2026.
Buyers may be gradually gaining temporary control, lending support to the possibility of a short-term bullish recovery within the broader corrective structure.
- Conclusion
My preferred scenario currently suggests the following sequence:
1. Short term: A possible X-wave recovery, followed by another decline toward 72.5K–74K to complete wave B.
2. Medium term: A potential five-wave rally toward 93K–95K to complete wave C and the larger X-wave.
3. Longer term: A possible resumption of the broader bearish trend, potentially targeting the 50K region.
The overall sequence could potentially extend into late Q1 2027, although the timing remains subject to how the structure develops.
The developing price structure will determine whether this count remains valid or requires revision. However, the higher-timeframe wave count is expected to remain unchanged regardless of how this X-wave develops, unless Bitcoin breaks above 99K.
This advance seems to exhibit the characteristics of an impulsive move. However, rather than marking the beginning of a new bullish trend, it may represent wave A of a larger corrective zigzag (A-B-C).
- Wave B: A Complex Correction in Progress
Bitcoin now appears to be developing wave B of the proposed zigzag.
The initial corrective structure seems to have taken the form of an expanding triangle (A-B-C-D-E), as illustrated on the chart.
If this interpretation is correct, the triangle could be followed by a short-term X-wave recovery before another corrective structure develops to complete the larger wave B.
Under this scenario, wave B could eventually terminate within the 72.5K–74K region.
- Wave C: A Potential Rally Toward 93K–95K
Once wave B is complete, Bitcoin could begin wave C, potentially unfolding as another five-wave impulsive advance.
This would suggest a possible rally toward the 93K–95K region, completing the proposed A-B-C zigzag.
- The Bigger Picture: A Bearish Continuation?
As discussed in my previous analysis, the broader market structure suggests that Bitcoin may still be developing a larger corrective X-wave.
The zigzag outlined here could represent the final stage of that X-wave.
If this interpretation proves correct, its completion may mark the end of the corrective recovery, with Bitcoin potentially resuming its broader decline toward the 50K region.
- Weekly Chart: Signs of Weakening Selling Pressure
On the weekly chart, volume analysis appears to indicate weakening seller dominance compared to the stronger selling pressure observed since October 6, 2026.
Buyers may be gradually gaining temporary control, lending support to the possibility of a short-term bullish recovery within the broader corrective structure.
- Conclusion
My preferred scenario currently suggests the following sequence:
1. Short term: A possible X-wave recovery, followed by another decline toward 72.5K–74K to complete wave B.
2. Medium term: A potential five-wave rally toward 93K–95K to complete wave C and the larger X-wave.
3. Longer term: A possible resumption of the broader bearish trend, potentially targeting the 50K region.
The overall sequence could potentially extend into late Q1 2027, although the timing remains subject to how the structure develops.
The developing price structure will determine whether this count remains valid or requires revision. However, the higher-timeframe wave count is expected to remain unchanged regardless of how this X-wave develops, unless Bitcoin breaks above 99K.

Mostly just sharing how I see the markets
theonepct.substack.com
Telegram: bit.ly/TheOnePcT
theonepct.substack.com
Telegram: bit.ly/TheOnePcT
İlgili yayınlar
Feragatname
Bilgiler ve yayınlar, TradingView tarafından sağlanan veya onaylanan finansal, yatırım, alım satım veya diğer türden tavsiye veya öneriler anlamına gelmez ve teşkil etmez. Kullanım Koşulları bölümünde daha fazlasını okuyun.
Mostly just sharing how I see the markets
theonepct.substack.com
Telegram: bit.ly/TheOnePcT
theonepct.substack.com
Telegram: bit.ly/TheOnePcT
İlgili yayınlar
Feragatname
Bilgiler ve yayınlar, TradingView tarafından sağlanan veya onaylanan finansal, yatırım, alım satım veya diğer türden tavsiye veya öneriler anlamına gelmez ve teşkil etmez. Kullanım Koşulları bölümünde daha fazlasını okuyun.