
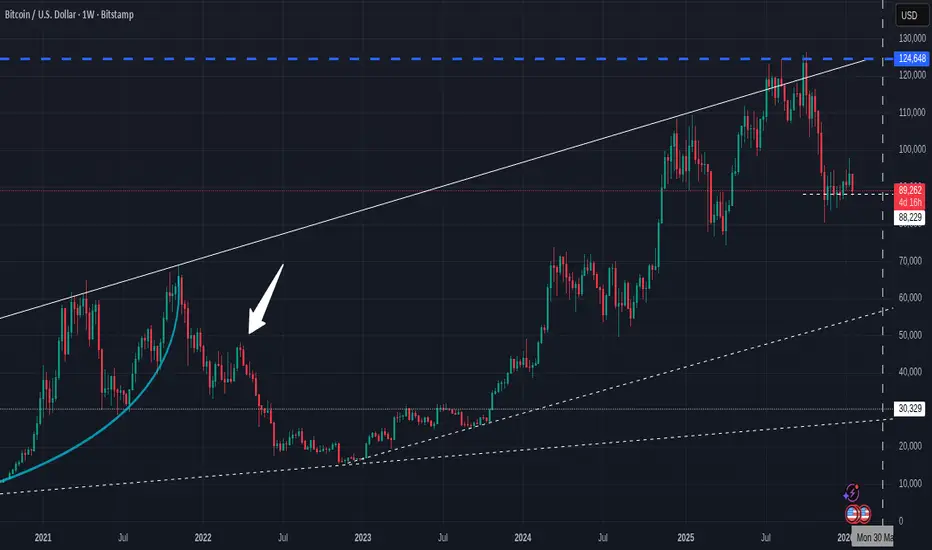
The Bitcoin Weekly PA chart and the Daily Chart below Offer us a number of pointers to Trends and Ideas to be found.
We can see llines of support and maybe, key moments
But if you combine this with the MACD, you have a far stronger hand.
First of all, What is the MACD ?
MACD, or Moving Average Convergence Divergence, is a widely used momentum indicator in technical analysis that helps traders identify trend direction, strength, and potential reversal points.
The indicator is calculated using two exponential moving averages (EMAs):
The MACD Line is the difference between a 12 EMA & 26 EMA of the price.
The Signal Line is a 9 EMA of the MACD Line.
The MACD Histogram represents the difference between the MACD Line and the Signal Line, visually showing momentum shifts.
Key signals include:
Crossovers: When the MACD Line crosses above the Signal Line, it signals a potential bullish trend; a cross below indicates a bearish trend.
Centerline Crossovers: When the MACD Line crosses above zero, it suggests bullish momentum; below zero indicates bearish momentum.
Divergences: When price makes a new high or low but MACD does not, it may signal a weakening trend and potential reversal.
MACD is a lagging indicator based on historical data, but its histogram can help anticipate trend changes.
When the Histogram bars are White, the Trend is loosing strength
One VERY important thing to remember is that MACD can Drop while PA ranges or Rises. MACD does not always show Price direction. Divergences are powerful
In the charts below, we have the MACD line in YELLOW and the Signal line in RED
Daily Bitcoin MACD
This Very clearly shows us how MACD is under a line of resistance and so we were able to foresee this current Drop in PA, as the MACD got rejected. This will continue to happpen until MACD crosses over that line.
This does not mean we will not see Rallies in Price but it does show the over all trend.
See how the Histogram colors are currently RED and so this Trend lower does not seem to be ending to soon. It may not be a DEEP Bear but we are Certainly Bearish right now.....The momentum is bearish
The WEEKLY MACD
Again, we see MACD under a line of resistance. (The Dotted line is the Daily) The Apex of this one is July 2027. This could give us an idea of how long MACD will be under pressure. Untill MACD breaks above that line, it is in a Bearish situation over all.
But look at the Histogram here. The Bars are Whilte and Getting smaller.
The "Local" trend is getting Weaker and we can see how MACD is down low, OverSold, turning and has the potential to Rise.....
Remember, there are 7 Daily Histogram bars to one of the Weekly.
Currently, we are seeing 2 RED Daily Histogram bars this week.
Change may be coming.....And we can see MACD Ranging sideways. It does not always have to Rise or Fall.
Another Weekly MACD idea
Looking back across previous MACD moves can give us ideas about possible moves.
On this Chart, we can see what happened last time MACD was as Low as it is now.
Firstly, notice the Histogram. See the reaction , the push higher.
This was Early 2023, when the last cycle push higher began.
Look at the Arrows on the left...See how Histogram Rose, a 2 peak Green Histogram, a Drop back to Red and then a sustained push higher.
The MACD Dropped, took a push higher a little, dropped to the low and then Turned up......
Could we be about to repeat that ?
YES, MAYBE, WE WILL SEE>...........................
But it certainly looks like we are currently going to get or have just had, a Rally higher and then a Dip lower......
THE MACD is a superb Tool and, if i am honest, is one of the MAJOR reasons behind my success.
It can be used as a simple Tool on its own but, with the RSI, it is almost unbeatable.

Nothing to be taken as Financial advice.
I will always say
"Only invest what you can afford to loose. When you are ready, take out your original investment. This way, it is only your profit that is at risk"
THAT is Financial advice
I will always say
"Only invest what you can afford to loose. When you are ready, take out your original investment. This way, it is only your profit that is at risk"
THAT is Financial advice
Feragatname
Bilgiler ve yayınlar, TradingView tarafından sağlanan veya onaylanan finansal, yatırım, alım satım veya diğer türden tavsiye veya öneriler anlamına gelmez ve teşkil etmez. Kullanım Koşulları bölümünde daha fazlasını okuyun.
Nothing to be taken as Financial advice.
I will always say
"Only invest what you can afford to loose. When you are ready, take out your original investment. This way, it is only your profit that is at risk"
THAT is Financial advice
I will always say
"Only invest what you can afford to loose. When you are ready, take out your original investment. This way, it is only your profit that is at risk"
THAT is Financial advice
Feragatname
Bilgiler ve yayınlar, TradingView tarafından sağlanan veya onaylanan finansal, yatırım, alım satım veya diğer türden tavsiye veya öneriler anlamına gelmez ve teşkil etmez. Kullanım Koşulları bölümünde daha fazlasını okuyun.