My First Bitcoin Basic Technical Analysis
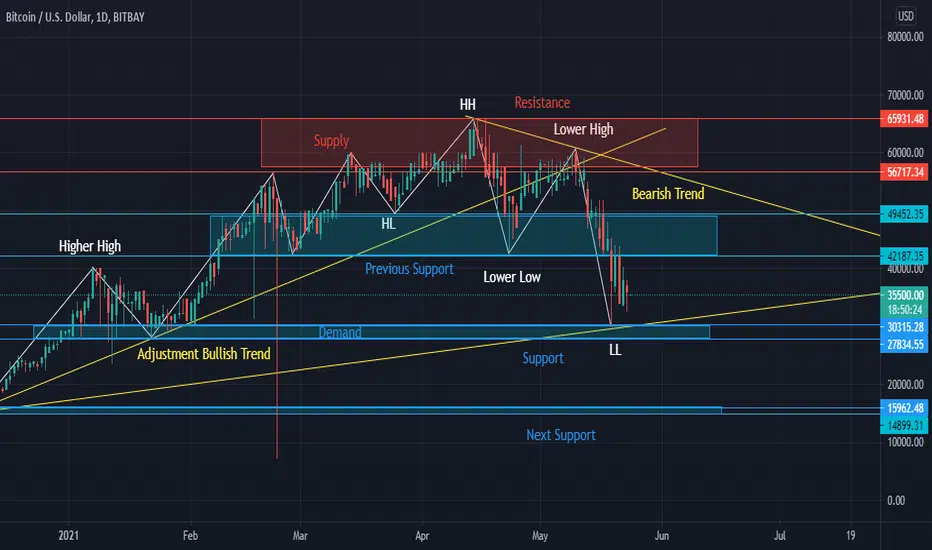
The 4 Basics:
1. Swing: in white line.
2. Trend: in yellow line.
3. Support & Resistance: Blue and Red lines.
4. Supply & Demand: in rectangles.
Summary:
The current trend is bearish after failing to break above $60000 and failing to maintain above $46000. A good buy opportunity between $28000 - $30000 especially if there is a rebound. However, a high probability of another market crash if the price drops below $28000 up to $16000 as the next support line.

Feragatname
Bilgiler ve yayınlar, TradingView tarafından sağlanan veya onaylanan finansal, yatırım, alım satım veya diğer türden tavsiye veya öneriler anlamına gelmez ve teşkil etmez. Kullanım Koşulları bölümünde daha fazlasını okuyun.
Feragatname
Bilgiler ve yayınlar, TradingView tarafından sağlanan veya onaylanan finansal, yatırım, alım satım veya diğer türden tavsiye veya öneriler anlamına gelmez ve teşkil etmez. Kullanım Koşulları bölümünde daha fazlasını okuyun.