
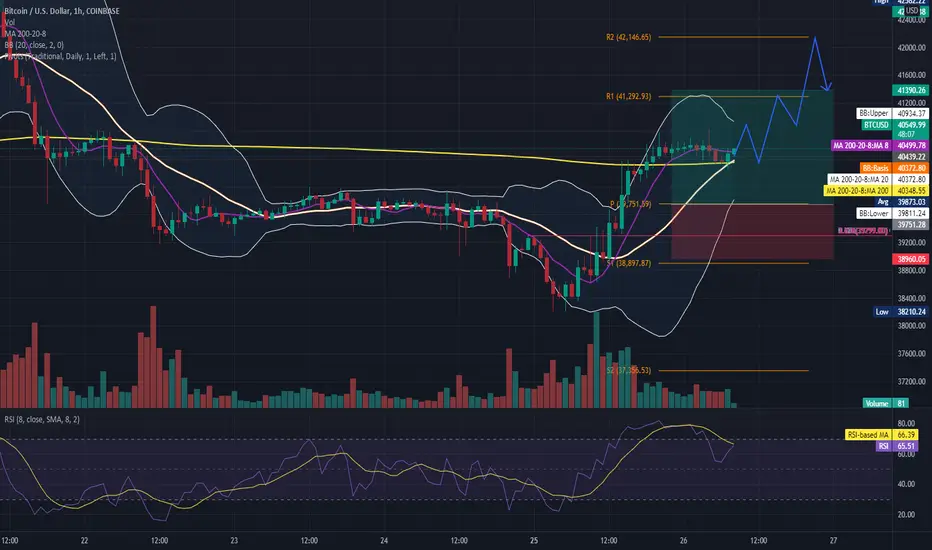
Hello traders, the price bouncing on the MA200, the price is over the pivot point, it might go up until R1 or R2. Pls, remember to check the trend. The prices could retrace until the inmediatly last band, bouncing, and then continue the trend. If the price breaks down the pivot point we will go in short. (downtrend)
Indicators MA 200, 20-8 RSI 8 MA8 Bolliger 20, Volume, Pivot points Levels. Intraday Strategy. 1-hour frame.
R3 44,541.71
R2 42,146.65
R1 41,292.93
PP 39,751.59
S1 38,897.87
S2 37,356.53
S3 34,961.47
Indicators MA 200, 20-8 RSI 8 MA8 Bolliger 20, Volume, Pivot points Levels. Intraday Strategy. 1-hour frame.
R3 44,541.71
R2 42,146.65
R1 41,292.93
PP 39,751.59
S1 38,897.87
S2 37,356.53
S3 34,961.47

Feragatname
Bilgiler ve yayınlar, TradingView tarafından sağlanan veya onaylanan finansal, yatırım, alım satım veya diğer türden tavsiye veya öneriler anlamına gelmez ve teşkil etmez. Kullanım Koşulları bölümünde daha fazlasını okuyun.
Feragatname
Bilgiler ve yayınlar, TradingView tarafından sağlanan veya onaylanan finansal, yatırım, alım satım veya diğer türden tavsiye veya öneriler anlamına gelmez ve teşkil etmez. Kullanım Koşulları bölümünde daha fazlasını okuyun.