
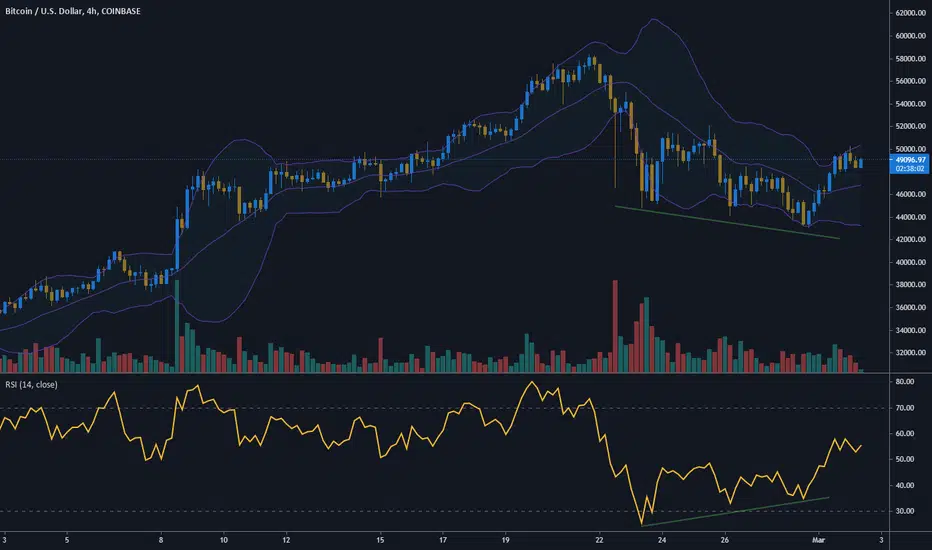
On the 4 hours chart, there is a divergence between the price and the RSI.
The price is doing lower lows but the RSI is doing higher lows.
In every new low, the price penetrates less and less the lower bollinger band.
Bullish.
The price is doing lower lows but the RSI is doing higher lows.
In every new low, the price penetrates less and less the lower bollinger band.
Bullish.

Feragatname
Bilgiler ve yayınlar, TradingView tarafından sağlanan veya onaylanan finansal, yatırım, alım satım veya diğer türden tavsiye veya öneriler anlamına gelmez ve teşkil etmez. Kullanım Koşulları bölümünde daha fazlasını okuyun.
Feragatname
Bilgiler ve yayınlar, TradingView tarafından sağlanan veya onaylanan finansal, yatırım, alım satım veya diğer türden tavsiye veya öneriler anlamına gelmez ve teşkil etmez. Kullanım Koşulları bölümünde daha fazlasını okuyun.