
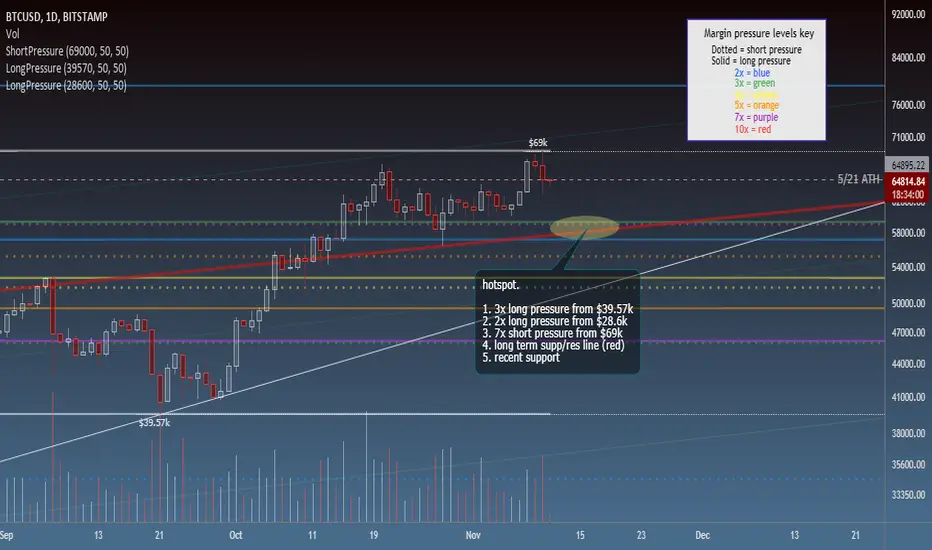
a retest of the may high ($64.9k) was blatantly obvious, and we may very well find support here and continue up. but if history is going to repeat itself, we could be dipping a bit further before the next leg up. if we do, i see a hotspot primed for a bounce around $58-59k:
1. 3x long pressure from $39.57k
2. 2x long pressure from $28.6k
3. 7x short pressure from $69k
4. retest of long term support/resistance line (red)
5. recent support
yes, that long term support/resistance line is the very same line that's been haunting bitcoin since 2014:
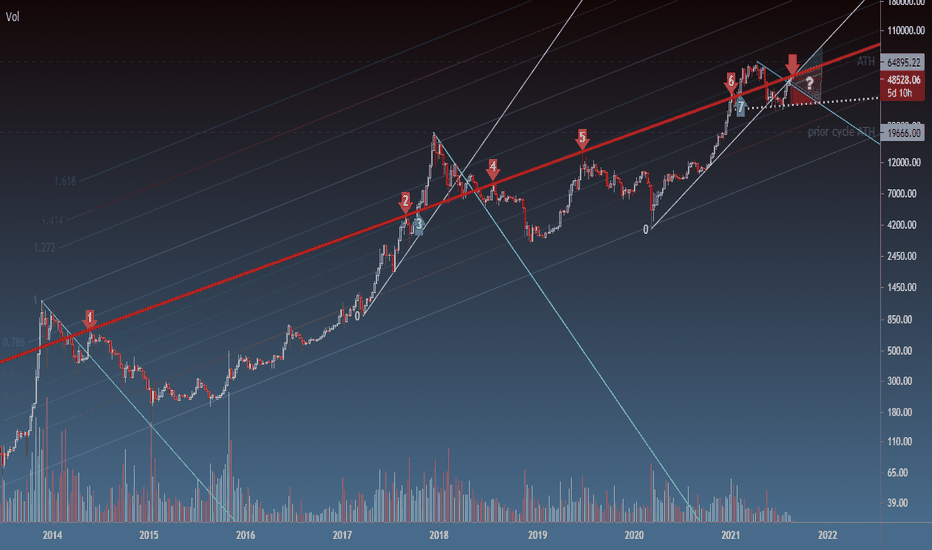
if price fails to find support here, the uptrend line/bottom of the channel (white) would be the next logical stop. and that would actually be about a 25% retracement, almost exactly the dip we saw on the same dates four years ago:
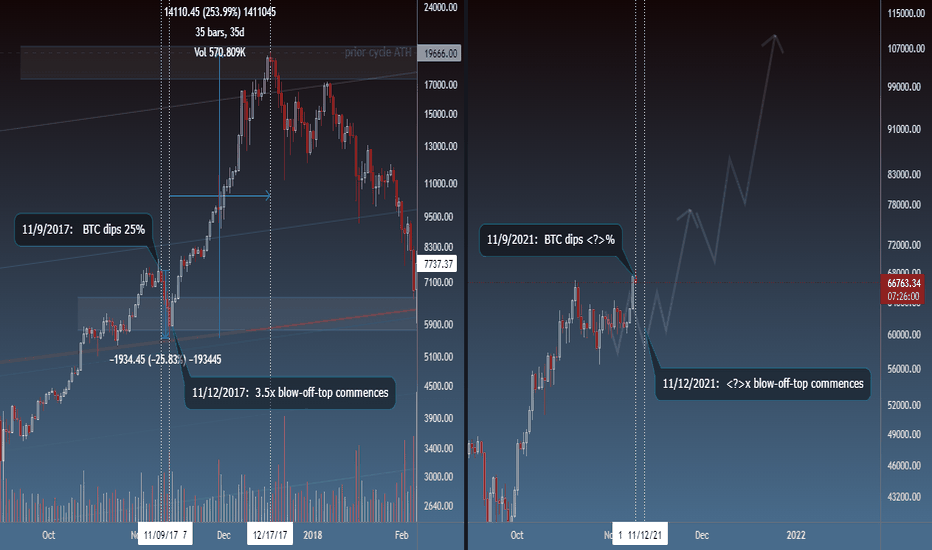
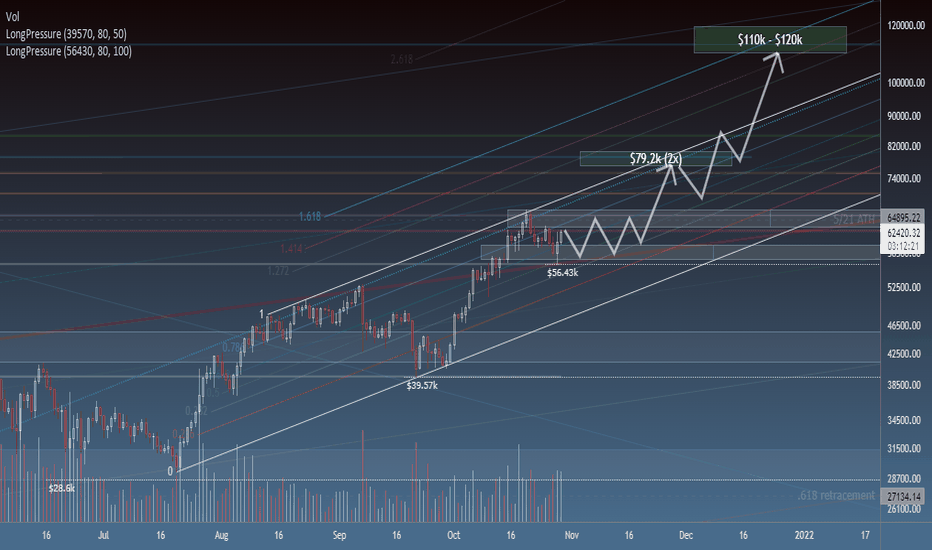
volatility can be tough to stomach, but it's the price you pay for big moves:
1. 3x long pressure from $39.57k
2. 2x long pressure from $28.6k
3. 7x short pressure from $69k
4. retest of long term support/resistance line (red)
5. recent support
yes, that long term support/resistance line is the very same line that's been haunting bitcoin since 2014:
if price fails to find support here, the uptrend line/bottom of the channel (white) would be the next logical stop. and that would actually be about a 25% retracement, almost exactly the dip we saw on the same dates four years ago:
volatility can be tough to stomach, but it's the price you pay for big moves:
Not
here we go Not
Not
i think we're good to go Not
well it looks like we got that trendline after all. -22.5%. 
İlgili yayınlar
Feragatname
Bilgiler ve yayınlar, TradingView tarafından sağlanan veya onaylanan finansal, yatırım, alım satım veya diğer türden tavsiye veya öneriler anlamına gelmez ve teşkil etmez. Kullanım Koşulları bölümünde daha fazlasını okuyun.
İlgili yayınlar
Feragatname
Bilgiler ve yayınlar, TradingView tarafından sağlanan veya onaylanan finansal, yatırım, alım satım veya diğer türden tavsiye veya öneriler anlamına gelmez ve teşkil etmez. Kullanım Koşulları bölümünde daha fazlasını okuyun.