
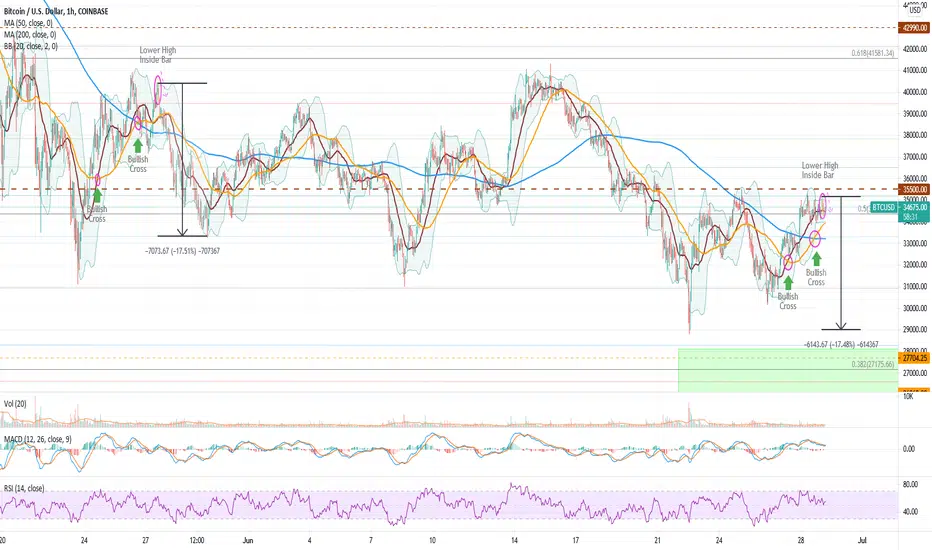
An interesting confluence of factors has manifest again in the 1HR chart that occurred back around May 26. That is the following:
In May, this portended an initial drop of 17.5% ($7k). If a similar drop occurred from the high of this recurrence, we could see a drop of $6.1k, back below $29k.
What do you think? A correction, a rally, or more sideways action?
- A Bullish cross of the 20MA above the 50MA; followed by
- A bullish cross of the 50MA above the 200MA; followed by
- An inside bar on a lower high.
In May, this portended an initial drop of 17.5% ($7k). If a similar drop occurred from the high of this recurrence, we could see a drop of $6.1k, back below $29k.
What do you think? A correction, a rally, or more sideways action?

İlgili yayınlar
Feragatname
Bilgiler ve yayınlar, TradingView tarafından sağlanan veya onaylanan finansal, yatırım, alım satım veya diğer türden tavsiye veya öneriler anlamına gelmez ve teşkil etmez. Kullanım Koşulları bölümünde daha fazlasını okuyun.
İlgili yayınlar
Feragatname
Bilgiler ve yayınlar, TradingView tarafından sağlanan veya onaylanan finansal, yatırım, alım satım veya diğer türden tavsiye veya öneriler anlamına gelmez ve teşkil etmez. Kullanım Koşulları bölümünde daha fazlasını okuyun.