
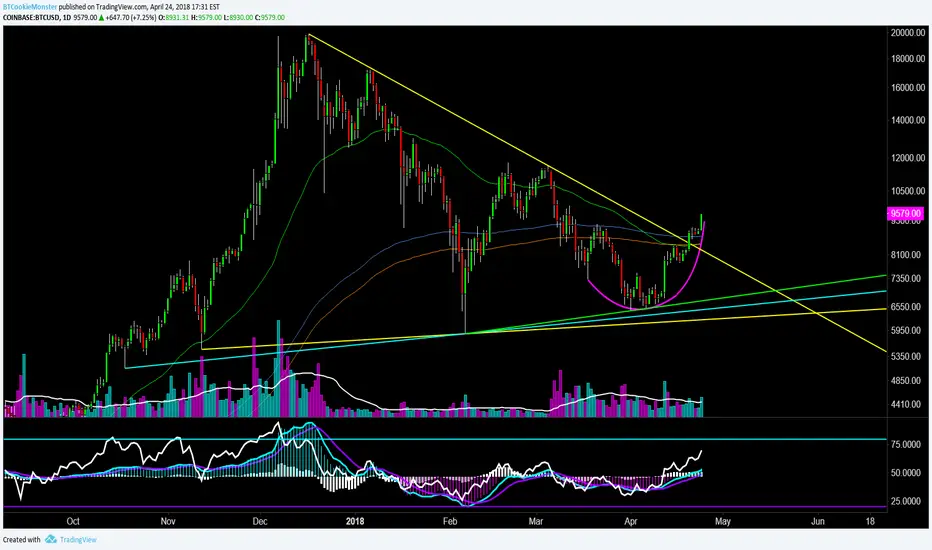
Beginning on April 1, 2018, BTC began making higher lows from 6450 to 6617, 6661.19, 6806.01; then a “dump” to 6767.77 took it that day to the high of 8050, a move of 1282.23. from there it continued to make a higher low, and the high of 8392.56, what I have counted as the top of my Primary Wave 1, until falling to 7822- currently the lowest low since coming up from 6767.77. The low of 7820 corresponds with my ABC Wave 2 down from the top of my Wave 1.

Since then BTC has posted higher lows on each Daily candle, literally confusing quite possibly every honest analyst as to what exactly its next move will be…
On April 19, 2018 BTC beached the downtrend line, from ATH and 11600, on the Logarithmic Daily Candle chart at 8520, and days before on the Linear chart at 7660.


On April 19 BTC also crossed above the 55, the 200, and the 233 Moving Day Average…

Taking a different approach to this analysis I began looking at the angle of projection of BTC; carrying through the 8398.98 High, BTC was climbing at an angle of 50°…with the following Highs at 65°…

Is there any significance to this? Well, lets look at some previous angles of near equivalence and see where they took BTC…

How about a look at the MACD on the Daily with the same perspective…

Candles on the Weekly? From Low of Previous Correction to ensuing All Time High…

And on the Monthly Chart from All Time Low to All Time High Log scale…

Some are saying “what if this is just another Corrective Wave up, before continuing down to the likes of sub 6k…well, let’s compare them…


The bottom at 5811 happened well below the center line of the MACG Histogram (an indicator of the MACD which shows the momentum of price action); the current movement which began on April 9, 2018, occurred above the center line of the Histogram, and in my opinion means there is a lot more action to come…furthermore, as some have been speculating that this is an ascending wedge destined to break downward, look at the proceeding angle of the Histogram after reaching the top (which some claim we have, or are, approaching. The top at 11800 immediately began a descent at -65°…while beginning on the 15th there was only a -5° decrease in the Histogram with sideways action, telling me that this is just the beginning of the movement up.

The Daily chart above shows where BTC currently sits overall…

Steadily climbing above the 55/200/233 MA’s, and currently within what is the beginning of Wave 3 of 3…
Movement within its current channel takes BTC to 10300, 11100, 12000…

and we will be seeing 14k sooner than later…then the FOMO begins…
I will be updating this on the regular…strap in…
Since then BTC has posted higher lows on each Daily candle, literally confusing quite possibly every honest analyst as to what exactly its next move will be…
On April 19, 2018 BTC beached the downtrend line, from ATH and 11600, on the Logarithmic Daily Candle chart at 8520, and days before on the Linear chart at 7660.
On April 19 BTC also crossed above the 55, the 200, and the 233 Moving Day Average…
Taking a different approach to this analysis I began looking at the angle of projection of BTC; carrying through the 8398.98 High, BTC was climbing at an angle of 50°…with the following Highs at 65°…
Is there any significance to this? Well, lets look at some previous angles of near equivalence and see where they took BTC…
How about a look at the MACD on the Daily with the same perspective…
Candles on the Weekly? From Low of Previous Correction to ensuing All Time High…
And on the Monthly Chart from All Time Low to All Time High Log scale…
Some are saying “what if this is just another Corrective Wave up, before continuing down to the likes of sub 6k…well, let’s compare them…
The bottom at 5811 happened well below the center line of the MACG Histogram (an indicator of the MACD which shows the momentum of price action); the current movement which began on April 9, 2018, occurred above the center line of the Histogram, and in my opinion means there is a lot more action to come…furthermore, as some have been speculating that this is an ascending wedge destined to break downward, look at the proceeding angle of the Histogram after reaching the top (which some claim we have, or are, approaching. The top at 11800 immediately began a descent at -65°…while beginning on the 15th there was only a -5° decrease in the Histogram with sideways action, telling me that this is just the beginning of the movement up.
The Daily chart above shows where BTC currently sits overall…
Steadily climbing above the 55/200/233 MA’s, and currently within what is the beginning of Wave 3 of 3…
Movement within its current channel takes BTC to 10300, 11100, 12000…
and we will be seeing 14k sooner than later…then the FOMO begins…
I will be updating this on the regular…strap in…
Not
Lets take a quick look at what some of the Alts did with their brief stint in the spot light...just up until April, 21:LTCUSD
BCHUSD
ETHUSD
XRPUSD
IOTABTC
ADABTC
GASBTC
And how about now:
BCHUSD
LTCUSD
ETHUSD
And BTC...
Not
Updated count; BTC just popped above the MA's...

Feragatname
Bilgiler ve yayınlar, TradingView tarafından sağlanan veya onaylanan finansal, yatırım, alım satım veya diğer türden tavsiye veya öneriler anlamına gelmez ve teşkil etmez. Kullanım Koşulları bölümünde daha fazlasını okuyun.
Feragatname
Bilgiler ve yayınlar, TradingView tarafından sağlanan veya onaylanan finansal, yatırım, alım satım veya diğer türden tavsiye veya öneriler anlamına gelmez ve teşkil etmez. Kullanım Koşulları bölümünde daha fazlasını okuyun.