
BTCUSD | 1D
Core Idea
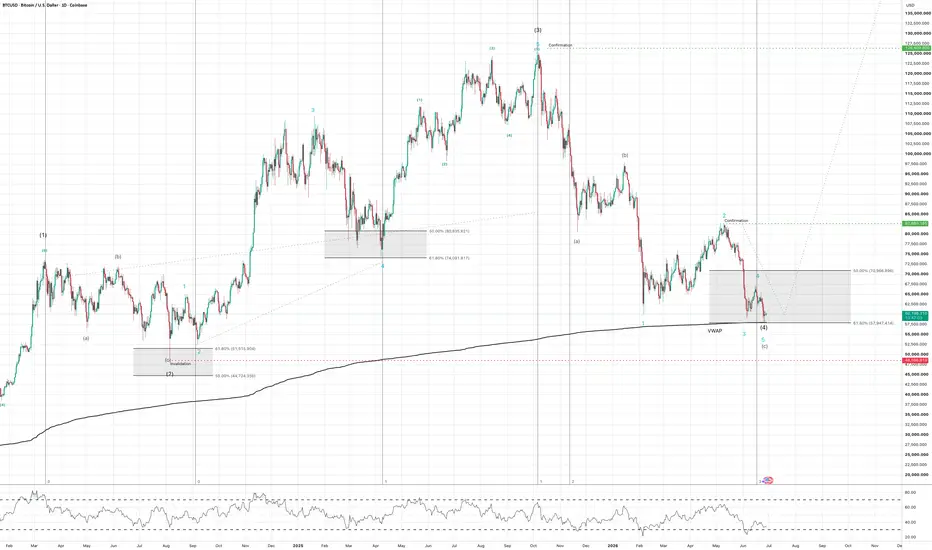
Bitcoin has reached the projected Wave (4) support zone and is now testing the most important confluence area on the chart.
Price is trading around 60,000, directly above the 61.8% retracement at 57,947 and in close contact with the rising VWAP. This is exactly the type of area where a Wave (4) should start losing downside pressure if the larger bullish cycle is still intact.
The chart is not fully confirmed bullish yet, but the location is technically attractive.
Elliott Wave Structure
The preferred count treats 126,409 as the completion of Wave (3). The current decline is labeled as Wave (4).
The active Wave (4) zone:
70,966: 50.0% retracement
57,947: 61.8% retracement and VWAP confluence
BTC has already reached the lower part of this zone. A sustained hold above 57,947 would support the idea that Wave (4) is close to completion.
VWAP Confluence
The VWAP is the key line here. It runs directly through the lower side of the Wave (4) box.
As long as BTC holds the VWAP and 57,947, the correction can still be treated as a controlled Wave (4) reset. A decisive break below the VWAP would weaken this view and shift attention toward the invalidation area.
Key Levels
57,947: main Wave (4) support and VWAP confluence
48,596: invalidation of the preferred bullish count
70,966: first reclaim level
82,680: confirmation that Wave (5) is likely starting
126,409: breakout confirmation above the Wave (3) high
Bullish Scenario
If BTC holds 57,947 and starts reclaiming 70,966, the Wave (4) low becomes increasingly credible.
A break above 82,680 would be the first real confirmation that Wave (5) is underway. Above 126,409, the larger bullish expansion would be confirmed.
The projected Wave (5) target zone sits between:
239,388: 1.618 extension
282,189: 2.0 extension
Bearish Scenario
If BTC loses 57,947 and fails to recover the VWAP quickly, the Wave (4) setup weakens.
Below 48,596, the preferred bullish continuation count is invalidated. In that case, the move into 126,409 would need to be treated as a completed larger advance followed by a deeper correction.
Timing
The Wave (4) low is developing in the current time window.
If the current VWAP confluence holds, a recovery toward 70,966 and 82,680 could develop during Q3 2026.
A larger Wave (5) advance would more likely be a 2027 structure. The strongest projected timing window for the 239,388 to 282,189 target zone is Q2 to Q3 2027.
Conclusion
BTC has reached the Wave (4) projection zone in direct confluence with the VWAP.
As long as 57,947 holds, the bullish continuation scenario remains active. Above 82,680, Wave (5) gains confirmation. Below 48,596, the count is invalidated.
Core Idea
Bitcoin has reached the projected Wave (4) support zone and is now testing the most important confluence area on the chart.
Price is trading around 60,000, directly above the 61.8% retracement at 57,947 and in close contact with the rising VWAP. This is exactly the type of area where a Wave (4) should start losing downside pressure if the larger bullish cycle is still intact.
The chart is not fully confirmed bullish yet, but the location is technically attractive.
Elliott Wave Structure
The preferred count treats 126,409 as the completion of Wave (3). The current decline is labeled as Wave (4).
The active Wave (4) zone:
70,966: 50.0% retracement
57,947: 61.8% retracement and VWAP confluence
BTC has already reached the lower part of this zone. A sustained hold above 57,947 would support the idea that Wave (4) is close to completion.
VWAP Confluence
The VWAP is the key line here. It runs directly through the lower side of the Wave (4) box.
As long as BTC holds the VWAP and 57,947, the correction can still be treated as a controlled Wave (4) reset. A decisive break below the VWAP would weaken this view and shift attention toward the invalidation area.
Key Levels
57,947: main Wave (4) support and VWAP confluence
48,596: invalidation of the preferred bullish count
70,966: first reclaim level
82,680: confirmation that Wave (5) is likely starting
126,409: breakout confirmation above the Wave (3) high
Bullish Scenario
If BTC holds 57,947 and starts reclaiming 70,966, the Wave (4) low becomes increasingly credible.
A break above 82,680 would be the first real confirmation that Wave (5) is underway. Above 126,409, the larger bullish expansion would be confirmed.
The projected Wave (5) target zone sits between:
239,388: 1.618 extension
282,189: 2.0 extension
Bearish Scenario
If BTC loses 57,947 and fails to recover the VWAP quickly, the Wave (4) setup weakens.
Below 48,596, the preferred bullish continuation count is invalidated. In that case, the move into 126,409 would need to be treated as a completed larger advance followed by a deeper correction.
Timing
The Wave (4) low is developing in the current time window.
If the current VWAP confluence holds, a recovery toward 70,966 and 82,680 could develop during Q3 2026.
A larger Wave (5) advance would more likely be a 2027 structure. The strongest projected timing window for the 239,388 to 282,189 target zone is Q2 to Q3 2027.
Conclusion
BTC has reached the Wave (4) projection zone in direct confluence with the VWAP.
As long as 57,947 holds, the bullish continuation scenario remains active. Above 82,680, Wave (5) gains confirmation. Below 48,596, the count is invalidated.

Feragatname
Bilgiler ve yayınlar, TradingView tarafından sağlanan veya onaylanan finansal, yatırım, alım satım veya diğer türden tavsiye veya öneriler anlamına gelmez ve teşkil etmez. Kullanım Koşulları bölümünde daha fazlasını okuyun.
Feragatname
Bilgiler ve yayınlar, TradingView tarafından sağlanan veya onaylanan finansal, yatırım, alım satım veya diğer türden tavsiye veya öneriler anlamına gelmez ve teşkil etmez. Kullanım Koşulları bölümünde daha fazlasını okuyun.