
Hello my dear friends
In the weekly chart, a pattern with an upward target has been formed for us. Positive divergence of RSI in the daily chart!!!
The price broke out of the daily compression from the bottom side, according to the analysis (:
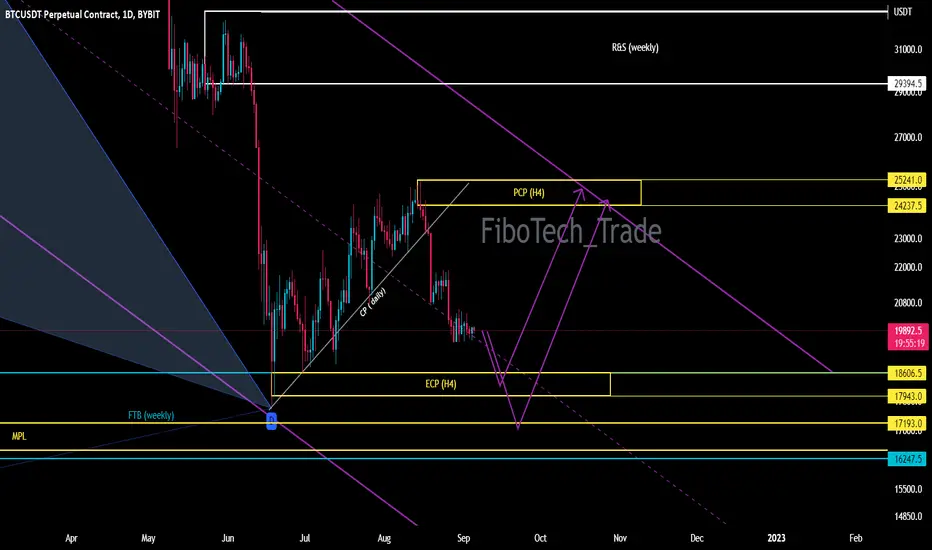
The downward trend should continue until the price range of $18606. As long as the price range of $16,240 is maintained, there is a high probability of forming an upward trend similar to the drawn scenario.
We would be happy to hear your comments.
In the weekly chart, a pattern with an upward target has been formed for us. Positive divergence of RSI in the daily chart!!!
The price broke out of the daily compression from the bottom side, according to the analysis (:
The downward trend should continue until the price range of $18606. As long as the price range of $16,240 is maintained, there is a high probability of forming an upward trend similar to the drawn scenario.
We would be happy to hear your comments.
Not
Not
We reached the first range we specified.Probably we will have a positive reaction on this area.

Feragatname
Bilgiler ve yayınlar, TradingView tarafından sağlanan veya onaylanan finansal, yatırım, alım satım veya diğer türden tavsiye veya öneriler anlamına gelmez ve teşkil etmez. Kullanım Koşulları bölümünde daha fazlasını okuyun.
Feragatname
Bilgiler ve yayınlar, TradingView tarafından sağlanan veya onaylanan finansal, yatırım, alım satım veya diğer türden tavsiye veya öneriler anlamına gelmez ve teşkil etmez. Kullanım Koşulları bölümünde daha fazlasını okuyun.