
BTCUSDT — Final Correction Before Explosive Rally to New ATH?
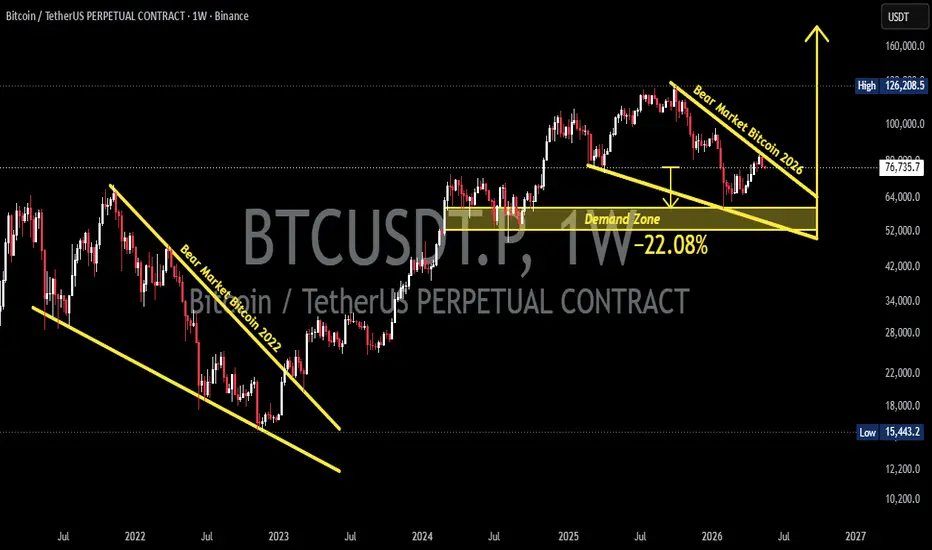
This BTCUSDT 1W timeframe chart shows a very interesting structure because it has strong similarities to the 2022 Bitcoin Bear Market pattern 🐻📉. Currently, the price action appears to be forming a major corrective structure after failing to maintain the previous ATH area.
The chart shows:
- 🔻 Descending resistance (downtrend line)
- 🟨 Strong Demand Zone around $60,000 — $52,500
- 📉 A correction structure of around -22%
- ⚠️ Potential fake breakdown before a major bullish expansion
The yellow zone between $60K — $52.5K is becoming the most important area in determining Bitcoin’s next direction 🧭💰
---
📉 Chart Structure Analysis
The current structure is forming a:
🔻 Falling Wedge / Descending Broadening Structure
This pattern often appears when the market enters a distribution phase or the final stage of a correction before a major reversal happens 🔄📊
Characteristics visible on the chart:
- 📉 Continuous Lower High formation
- 🐻 Selling pressure starting to weaken
- 🎯 Price moving toward a major demand zone
- 📊 Volatility beginning to tighten
Historically, structures like this on Bitcoin often end with:
1. 💧 Liquidity sweep to the downside
2. 🔄 Support reclaim
3. 🚀 Explosive breakout upward
---
🟨 Major BTC Demand Zone
Yellow Zone:
💰 $60,000 — $52,500
This area represents:
- 🛡️ Strong weekly support
- 🏦 Potential re-accumulation zone
- 🧠 Psychological market area
- 📈 Mid-term bullish validation zone
As long as BTC remains above this area, the macro bullish structure is still considered valid ✅🐂
---
🚀 Bullish Scenario
✅ Bullish Scenario
If BTC can:
- 📍 Hold above the $60K — $52.5K demand zone
- 🔥 Break out from the descending resistance
- 📈 Form a new Higher High
Then the potential move could be:
- 🎯 Re-test the previous ATH
- 🚀 Continue bullish expansion
- 💎 Move toward a new psychological area above $120K
The chart even illustrates the possibility of a massive impulsive rally after the correction phase is completed ⚡📈
Bullish momentum would become even stronger if breakout volume increases and weekly candles close back above the resistance trendline 📊🔥
---
🐻 Bearish Scenario
❌ Bearish Scenario
If BTC fails to hold the demand zone:
- 📉 Breakdown below $52.5K
- ⚠️ Weekly close below major support
- 🩸 Seller volume increases significantly
Then the market could enter a deeper correction phase:
- 🌊 Large liquidity sweep
- 😨 Panic selling
- 📍 Retest of the next macro support
However, as long as there is no valid breakdown below the demand zone, this area is still considered a strong institutional buyback zone 🏦🟨
---
🧠 Conclusion
BTC is currently at a crucial area that could determine the market direction for the next several months ⏳📊
The chart structure shows similarities to the previous bear market phase, but it also opens the possibility of forming a:
⚡ “Final Shakeout Before Massive Bull Run” 🚀🐂
The $60K — $52.5K demand zone is the most important area to monitor because it could become a major reversal point if buyers regain market dominance 💰📈
---
#BTC #Bitcoin #BTCUSDT #Crypto #Cryptocurrency #TradingView #TechnicalAnalysis #PriceAction #SmartMoney #SupplyDemand #BitcoinAnalysis #CryptoTrading #BullRun #BearMarket #BTCAnalysis #Altcoin #MarketStructure #Trader #Investing #WeeklyChart
The chart shows:
- 🔻 Descending resistance (downtrend line)
- 🟨 Strong Demand Zone around $60,000 — $52,500
- 📉 A correction structure of around -22%
- ⚠️ Potential fake breakdown before a major bullish expansion
The yellow zone between $60K — $52.5K is becoming the most important area in determining Bitcoin’s next direction 🧭💰
---
📉 Chart Structure Analysis
The current structure is forming a:
🔻 Falling Wedge / Descending Broadening Structure
This pattern often appears when the market enters a distribution phase or the final stage of a correction before a major reversal happens 🔄📊
Characteristics visible on the chart:
- 📉 Continuous Lower High formation
- 🐻 Selling pressure starting to weaken
- 🎯 Price moving toward a major demand zone
- 📊 Volatility beginning to tighten
Historically, structures like this on Bitcoin often end with:
1. 💧 Liquidity sweep to the downside
2. 🔄 Support reclaim
3. 🚀 Explosive breakout upward
---
🟨 Major BTC Demand Zone
Yellow Zone:
💰 $60,000 — $52,500
This area represents:
- 🛡️ Strong weekly support
- 🏦 Potential re-accumulation zone
- 🧠 Psychological market area
- 📈 Mid-term bullish validation zone
As long as BTC remains above this area, the macro bullish structure is still considered valid ✅🐂
---
🚀 Bullish Scenario
✅ Bullish Scenario
If BTC can:
- 📍 Hold above the $60K — $52.5K demand zone
- 🔥 Break out from the descending resistance
- 📈 Form a new Higher High
Then the potential move could be:
- 🎯 Re-test the previous ATH
- 🚀 Continue bullish expansion
- 💎 Move toward a new psychological area above $120K
The chart even illustrates the possibility of a massive impulsive rally after the correction phase is completed ⚡📈
Bullish momentum would become even stronger if breakout volume increases and weekly candles close back above the resistance trendline 📊🔥
---
🐻 Bearish Scenario
❌ Bearish Scenario
If BTC fails to hold the demand zone:
- 📉 Breakdown below $52.5K
- ⚠️ Weekly close below major support
- 🩸 Seller volume increases significantly
Then the market could enter a deeper correction phase:
- 🌊 Large liquidity sweep
- 😨 Panic selling
- 📍 Retest of the next macro support
However, as long as there is no valid breakdown below the demand zone, this area is still considered a strong institutional buyback zone 🏦🟨
---
🧠 Conclusion
BTC is currently at a crucial area that could determine the market direction for the next several months ⏳📊
The chart structure shows similarities to the previous bear market phase, but it also opens the possibility of forming a:
⚡ “Final Shakeout Before Massive Bull Run” 🚀🐂
The $60K — $52.5K demand zone is the most important area to monitor because it could become a major reversal point if buyers regain market dominance 💰📈
---
#BTC #Bitcoin #BTCUSDT #Crypto #Cryptocurrency #TradingView #TechnicalAnalysis #PriceAction #SmartMoney #SupplyDemand #BitcoinAnalysis #CryptoTrading #BullRun #BearMarket #BTCAnalysis #Altcoin #MarketStructure #Trader #Investing #WeeklyChart

✅ Get Free Signals! Join Our Telegram Channel Here: t.me/TheCryptoNuclear
✅ Twitter: twitter.com/crypto_nuclear
✅ Join Bybit : partner.bybit.com/b/nuclearvip
✅ Benefits : Lifetime Trading Fee Discount -50%
✅ Twitter: twitter.com/crypto_nuclear
✅ Join Bybit : partner.bybit.com/b/nuclearvip
✅ Benefits : Lifetime Trading Fee Discount -50%
Feragatname
Bilgiler ve yayınlar, TradingView tarafından sağlanan veya onaylanan finansal, yatırım, alım satım veya diğer türden tavsiye veya öneriler anlamına gelmez ve teşkil etmez. Kullanım Koşulları bölümünde daha fazlasını okuyun.
✅ Get Free Signals! Join Our Telegram Channel Here: t.me/TheCryptoNuclear
✅ Twitter: twitter.com/crypto_nuclear
✅ Join Bybit : partner.bybit.com/b/nuclearvip
✅ Benefits : Lifetime Trading Fee Discount -50%
✅ Twitter: twitter.com/crypto_nuclear
✅ Join Bybit : partner.bybit.com/b/nuclearvip
✅ Benefits : Lifetime Trading Fee Discount -50%
Feragatname
Bilgiler ve yayınlar, TradingView tarafından sağlanan veya onaylanan finansal, yatırım, alım satım veya diğer türden tavsiye veya öneriler anlamına gelmez ve teşkil etmez. Kullanım Koşulları bölümünde daha fazlasını okuyun.