
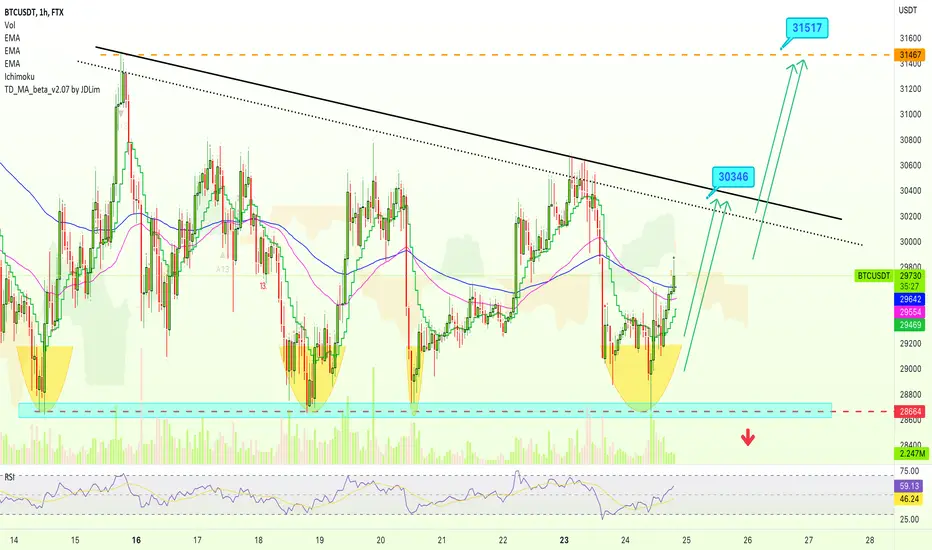
Notice the light blue/red dashed line on this chart...
This is our support level.
Notice the black descending trend-line...
This is our resistance.
Yesterday Bitcoin moved to challenge our resistance and was rejected.
Today we see a bounce at support.
This same support level has been holding for the past 10 days.
It was tested 3 times before and every time Bitcoin bounced.
Now we see BTCUSD moving above EMA50 and EMA100 on this timeframe (1H).
You can see the next target mapped on the chart.
Namaste.
This is our support level.
Notice the black descending trend-line...
This is our resistance.
Yesterday Bitcoin moved to challenge our resistance and was rejected.
Today we see a bounce at support.
This same support level has been holding for the past 10 days.
It was tested 3 times before and every time Bitcoin bounced.
Now we see BTCUSD moving above EMA50 and EMA100 on this timeframe (1H).
You can see the next target mapped on the chart.
Namaste.

✅ Cryptocurrencies technical analysis & results
t.me/masteranandatrades/9279
✅ Stocks technical analysis
t.me/anandastocks
✅ Enjoyed the content? Join my PREMIUM channels for more... t.me/lamatrades/4 (since 2017)
t.me/masteranandatrades/9279
✅ Stocks technical analysis
t.me/anandastocks
✅ Enjoyed the content? Join my PREMIUM channels for more... t.me/lamatrades/4 (since 2017)
İlgili yayınlar
Feragatname
Bilgiler ve yayınlar, TradingView tarafından sağlanan veya onaylanan finansal, yatırım, alım satım veya diğer türden tavsiye veya öneriler anlamına gelmez ve teşkil etmez. Kullanım Koşulları bölümünde daha fazlasını okuyun.
✅ Cryptocurrencies technical analysis & results
t.me/masteranandatrades/9279
✅ Stocks technical analysis
t.me/anandastocks
✅ Enjoyed the content? Join my PREMIUM channels for more... t.me/lamatrades/4 (since 2017)
t.me/masteranandatrades/9279
✅ Stocks technical analysis
t.me/anandastocks
✅ Enjoyed the content? Join my PREMIUM channels for more... t.me/lamatrades/4 (since 2017)
İlgili yayınlar
Feragatname
Bilgiler ve yayınlar, TradingView tarafından sağlanan veya onaylanan finansal, yatırım, alım satım veya diğer türden tavsiye veya öneriler anlamına gelmez ve teşkil etmez. Kullanım Koşulları bölümünde daha fazlasını okuyun.