
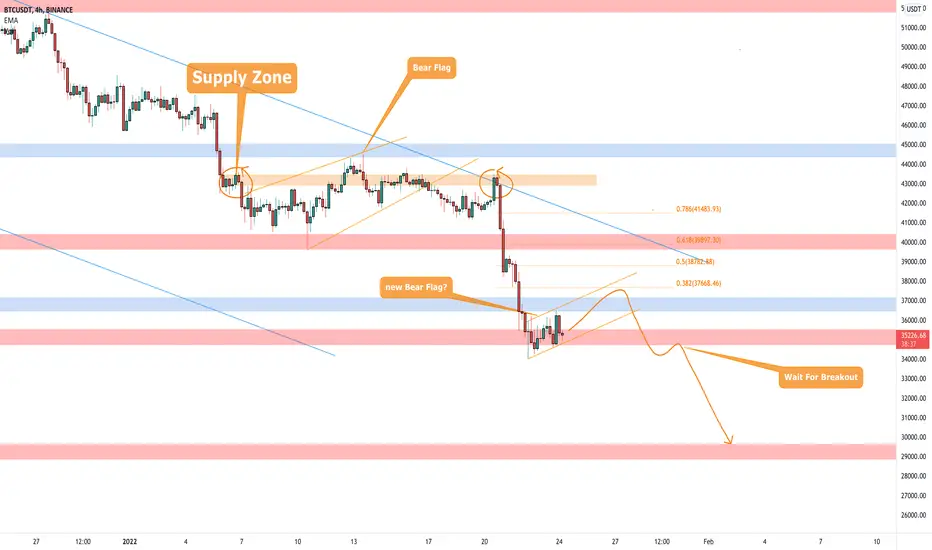
The price is creating another bear flag above the weekly support.
After the rejection from the supply zone, the price had a breakout from the weekly support, and not the market is testing the 35k weekly support below the daily resistance.
We could see a pullback until 0.382 - 0.5 Fibonacci level before a new leg down.
How to approach?
IF the price is going to have a breakout from the 35k and retest the previous support as new resistance we can look for a new short position applying our rules.
Be Aware of this support, because it's red support. it means that it's a weekly structure and you could see false breakouts.
Next valid support is 30k
–––––
Follow the Shrimp 🦐
Keep in mind.
After the rejection from the supply zone, the price had a breakout from the weekly support, and not the market is testing the 35k weekly support below the daily resistance.
We could see a pullback until 0.382 - 0.5 Fibonacci level before a new leg down.
How to approach?
IF the price is going to have a breakout from the 35k and retest the previous support as new resistance we can look for a new short position applying our rules.
Be Aware of this support, because it's red support. it means that it's a weekly structure and you could see false breakouts.
Next valid support is 30k
–––––
Follow the Shrimp 🦐
Keep in mind.
- 🟣 Purple structure -> Monthly structure.
- 🔴 Red structure -> Weekly structure.
- 🔵 Blue structure -> Daily structure.
- 🟡 Yellow structure -> 4h structure.
Not
the price had a breakout from the bear flag and now the market is trying to keep the weekly support.
No short position triggered so far, as you know a breakout is not enough!
Not
Be Careful with Bitcoin, the price had a false breakout from the bear flag and now it's testing the 0.382 Fibonacci level as I said in my previous analysis.
We didn't open any short position after a breakout because the price didn't trigger our rules.
On the upper chart, you can see how the SPX500 is testing the daily support after a pin bar with a retest of 0.382 Fibonacci level. We could see a "Fill the wick", the price could fill the wick of the green candle.
In that case, Bitcoin (the lower chart) is going to follow it and we could see a new leg down.
How to approach?
We need to see a clear breakdown of 35k to open a new short position according to our rules.
Be careful on 0.618 Fibonacci level where you can find a supply zone.
Not
Nice reaction from the 36k weekly support.
Now the price is going to test the 0.5 Fibonacci level, if you look on the left you can see a green candle between red candles, it means that we could see a rejection from that area.
Bullish above 40k
Not
Bitcoin had volatility due to FOMC and got a rejection from the supply zone (0.5 Fibonacci level )as I said in preview analysis.The price is still above the weekly support, and if the market is going to confirm this support we could see a new higher low.
How to approach?
The Price is between the range 39k-35k. If the price is going to have a breakdown from the weekly support, we could see a new bearish impulse until 30k.
Bullish above 40k
Not
The price got a rejection from the supply zone (Fibonacci 0.5) and the market is creating a new bear flag above the weekly support.
We are waiting for a new breakdown of weekly support to apply our rules for a new short position
Not
The market is testing the supply all day long.That area is very strong, we need to see a clear breakout with volume.
Bullish above the 40k
Not
The price got a rejection from the descending channel and supply zone.As I told during these days, bullish above the 40k
Wait for the Daily close

İlgili yayınlar
Feragatname
Bilgiler ve yayınlar, TradingView tarafından sağlanan veya onaylanan finansal, yatırım, alım satım veya diğer türden tavsiye veya öneriler anlamına gelmez ve teşkil etmez. Kullanım Koşulları bölümünde daha fazlasını okuyun.
İlgili yayınlar
Feragatname
Bilgiler ve yayınlar, TradingView tarafından sağlanan veya onaylanan finansal, yatırım, alım satım veya diğer türden tavsiye veya öneriler anlamına gelmez ve teşkil etmez. Kullanım Koşulları bölümünde daha fazlasını okuyun.