
Bitcoin "Channel Trend" Buying Climax
Hourly Time Frame Analysis
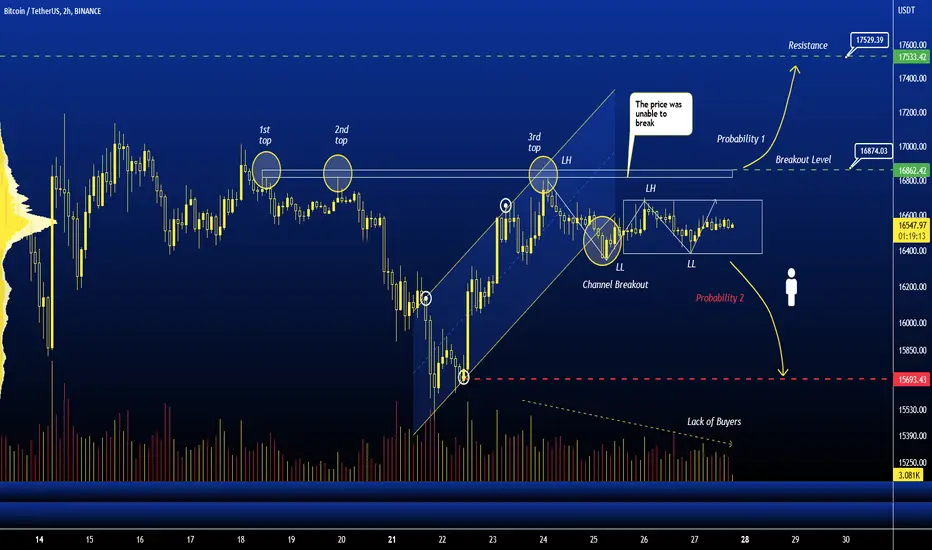
Since the 21st of November, Bitcoin has traded in the Ascending Channel Pattern range, and on the 25th of November, Bitcoin breached the Channel Trend Resistance with average volume, which should have improved exit odds and caused the price to begin consolidating in the range of 16385 $ to 16685 $.
As a result, we can anticipate two possibilities for price action based on the current movement.
Probability 1 : Price may break through the breakout level and price will rise to the resistance level of 17520 $.
Probability 2 : Once the Lower Low structure is broken, we may see a reversal trend, and then price may fall to the next support level of 15960$.
Happy Trading
Hourly Time Frame Analysis
Since the 21st of November, Bitcoin has traded in the Ascending Channel Pattern range, and on the 25th of November, Bitcoin breached the Channel Trend Resistance with average volume, which should have improved exit odds and caused the price to begin consolidating in the range of 16385 $ to 16685 $.
As a result, we can anticipate two possibilities for price action based on the current movement.
Probability 1 : Price may break through the breakout level and price will rise to the resistance level of 17520 $.
Probability 2 : Once the Lower Low structure is broken, we may see a reversal trend, and then price may fall to the next support level of 15960$.
Happy Trading
İşlem aktif
Not
Breakout DoneNot
İşlem aktif

İlgili yayınlar
Feragatname
Bilgiler ve yayınlar, TradingView tarafından sağlanan veya onaylanan finansal, yatırım, alım satım veya diğer türden tavsiye veya öneriler anlamına gelmez ve teşkil etmez. Kullanım Koşulları bölümünde daha fazlasını okuyun.
İlgili yayınlar
Feragatname
Bilgiler ve yayınlar, TradingView tarafından sağlanan veya onaylanan finansal, yatırım, alım satım veya diğer türden tavsiye veya öneriler anlamına gelmez ve teşkil etmez. Kullanım Koşulları bölümünde daha fazlasını okuyun.