
Market Thesis
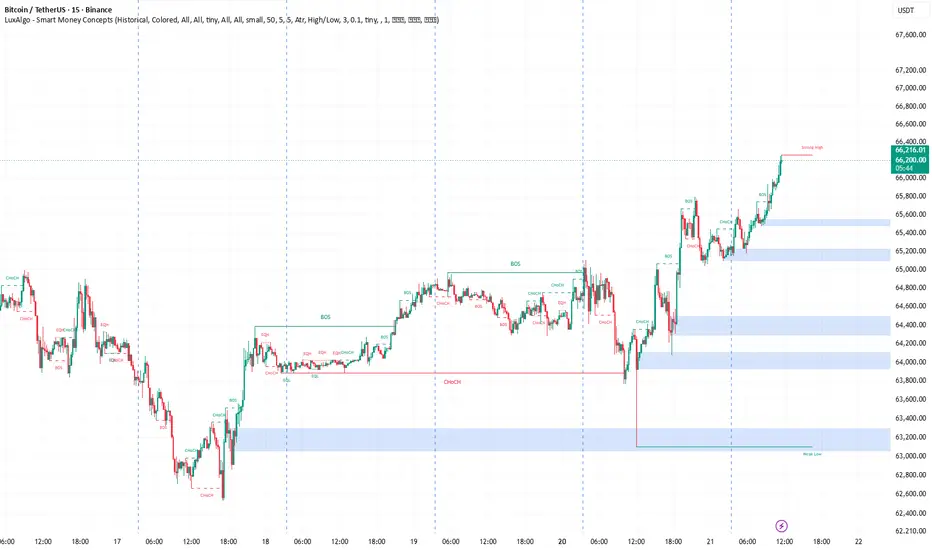
BTC remains decisively bullish on the 15-minute chart. The recovery from the 63,050–63,300 demand block produced strong displacement, multiple bullish BOS confirmations, and a clean sequence of higher highs and higher lows.
Price is now testing the visible Strong High near 66,260–66,320, placing the market in premium territory. Momentum favors continuation, but chasing directly beneath resistance offers poor risk-to-reward. The higher-quality edge is either a confirmed breakout above the strong high or a controlled retracement into visible bullish order blocks.
Visible SMC Confluences
Trend bias: Bullish. Structure has continued to expand upward since the rejection from approximately 63,100.
Liquidity grab: The sharp downside wick into the 63,050–63,300 zone swept lower prices and immediately reclaimed the range with displacement.
Bullish CHoCH: The reversal phase developed after price reclaimed the 63,850–64,000 structure area.
Bullish BOS sequence: Visible breaks occurred through approximately 64,400, 65,000, 65,550, and 65,800.
Displacement: Strong bullish momentum candles drove price from the lower demand zones into the current high with limited overlap.
Nearest bullish order block: 65,480–65,560.
Secondary bullish order block: 65,130–65,280.
Deeper reaction zone: 64,300–64,520.
Major intraday demand: 63,900–64,100.
Primary swing demand: 63,050–63,300.
Immediate resistance: 66,260–66,320, aligned with the LuxAlgo Strong High.
Premium positioning: Price is trading near the top of the visible 63,100–66,300 dealing range; pullback entries are preferable unless resistance is broken with confirmation.
Trade Scenarios
🟢 Scenario 1 — Breakout Continuation Buy
Bias: Buy
Entry area: 66,280–66,330
Trigger: A 15-minute momentum candle closes above 66,320, followed by a retest that holds above 66,260
Stop loss: 66,080
Take profit 1: 66,600
Take profit 2: 66,900
Take profit 3: 67,200
A wick above the high without a closing breakout is not sufficient. The level must be reclaimed and defended.
🟢 Scenario 2 — Order Block Pullback Buy
Bias: Buy
Entry area: 65,480–65,560
Trigger: Rejection wick from the zone followed by a bullish engulfing candle or lower-timeframe bullish CHoCH
Stop loss: 65,340
Take profit 1: 65,800
Take profit 2: 66,100
Take profit 3: 66,280
This is the nearest high-probability continuation zone and the first area where buyers may defend the current impulse.
🔴 Scenario 3 — Strong High Rejection Sell
Bias: Sell, countertrend
Entry area: 66,260–66,320
Trigger: Liquidity sweep above the Strong High, rejection back below 66,260, and a bearish engulfing close
Stop loss: 66,430
Take profit 1: 66,000
Take profit 2: 65,600
Take profit 3: 65,500
This setup is valid only after confirmed rejection. Selling solely because price has reached resistance is not enough.
Current edge: Bullish structure remains dominant, but the best execution is a confirmed break above 66,320 or a retracement into 65,480–65,560 rather than chasing price in premium.
BTC remains decisively bullish on the 15-minute chart. The recovery from the 63,050–63,300 demand block produced strong displacement, multiple bullish BOS confirmations, and a clean sequence of higher highs and higher lows.
Price is now testing the visible Strong High near 66,260–66,320, placing the market in premium territory. Momentum favors continuation, but chasing directly beneath resistance offers poor risk-to-reward. The higher-quality edge is either a confirmed breakout above the strong high or a controlled retracement into visible bullish order blocks.
Visible SMC Confluences
Trend bias: Bullish. Structure has continued to expand upward since the rejection from approximately 63,100.
Liquidity grab: The sharp downside wick into the 63,050–63,300 zone swept lower prices and immediately reclaimed the range with displacement.
Bullish CHoCH: The reversal phase developed after price reclaimed the 63,850–64,000 structure area.
Bullish BOS sequence: Visible breaks occurred through approximately 64,400, 65,000, 65,550, and 65,800.
Displacement: Strong bullish momentum candles drove price from the lower demand zones into the current high with limited overlap.
Nearest bullish order block: 65,480–65,560.
Secondary bullish order block: 65,130–65,280.
Deeper reaction zone: 64,300–64,520.
Major intraday demand: 63,900–64,100.
Primary swing demand: 63,050–63,300.
Immediate resistance: 66,260–66,320, aligned with the LuxAlgo Strong High.
Premium positioning: Price is trading near the top of the visible 63,100–66,300 dealing range; pullback entries are preferable unless resistance is broken with confirmation.
Trade Scenarios
🟢 Scenario 1 — Breakout Continuation Buy
Bias: Buy
Entry area: 66,280–66,330
Trigger: A 15-minute momentum candle closes above 66,320, followed by a retest that holds above 66,260
Stop loss: 66,080
Take profit 1: 66,600
Take profit 2: 66,900
Take profit 3: 67,200
A wick above the high without a closing breakout is not sufficient. The level must be reclaimed and defended.
🟢 Scenario 2 — Order Block Pullback Buy
Bias: Buy
Entry area: 65,480–65,560
Trigger: Rejection wick from the zone followed by a bullish engulfing candle or lower-timeframe bullish CHoCH
Stop loss: 65,340
Take profit 1: 65,800
Take profit 2: 66,100
Take profit 3: 66,280
This is the nearest high-probability continuation zone and the first area where buyers may defend the current impulse.
🔴 Scenario 3 — Strong High Rejection Sell
Bias: Sell, countertrend
Entry area: 66,260–66,320
Trigger: Liquidity sweep above the Strong High, rejection back below 66,260, and a bearish engulfing close
Stop loss: 66,430
Take profit 1: 66,000
Take profit 2: 65,600
Take profit 3: 65,500
This setup is valid only after confirmed rejection. Selling solely because price has reached resistance is not enough.
Current edge: Bullish structure remains dominant, but the best execution is a confirmed break above 66,320 or a retracement into 65,480–65,560 rather than chasing price in premium.

Feragatname
Bilgiler ve yayınlar, TradingView tarafından sağlanan veya onaylanan finansal, yatırım, alım satım veya diğer türden tavsiye veya öneriler anlamına gelmez ve teşkil etmez. Kullanım Koşulları bölümünde daha fazlasını okuyun.
Feragatname
Bilgiler ve yayınlar, TradingView tarafından sağlanan veya onaylanan finansal, yatırım, alım satım veya diğer türden tavsiye veya öneriler anlamına gelmez ve teşkil etmez. Kullanım Koşulları bölümünde daha fazlasını okuyun.