
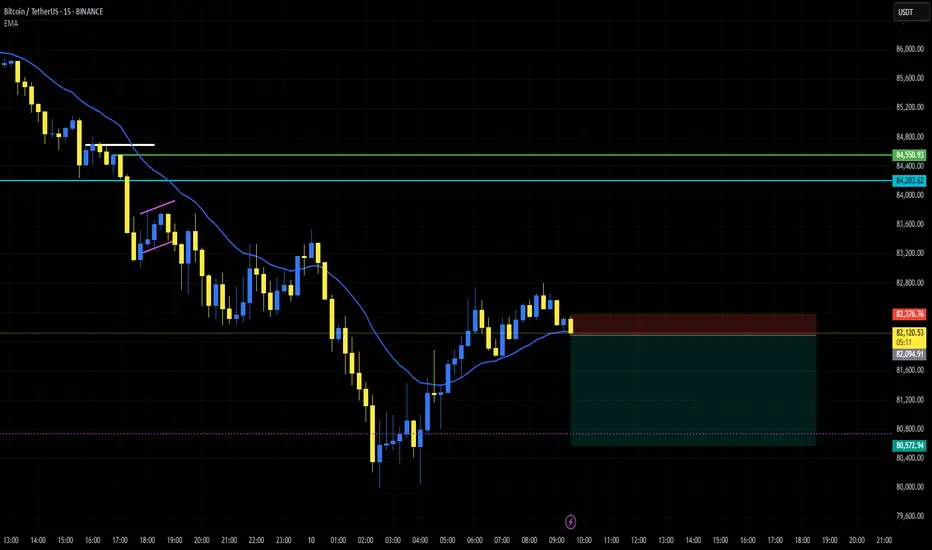
📉 **BTCUSDT Analysis – Bearish Structure on the 15-Minute Timeframe**
The chart indicates a strong downtrend in the 15-minute timeframe. After a continuous decline, the price is attempting a recovery, but this move appears to be more of a correction within the bearish trend. The price has shown weakness after touching the Exponential Moving Average (EMA), increasing the likelihood of further downside movement.
🔹 **Entry Level:** 82,205.98
🔹 **Stop Loss:** 82,376.76
🔹 **Final Target:** 80,572.94
**Key Levels:**
🔸 **Major Support:** 80,572.94
🔸 **Major Resistances:** 84,203.62 and 84,550.93
💡 Paying attention to the overall market trend and price reactions to key levels is crucial. In this strategy, **half of the trade volume should be closed at TP1** to secure profits and manage risk effectively.
The chart indicates a strong downtrend in the 15-minute timeframe. After a continuous decline, the price is attempting a recovery, but this move appears to be more of a correction within the bearish trend. The price has shown weakness after touching the Exponential Moving Average (EMA), increasing the likelihood of further downside movement.
🔹 **Entry Level:** 82,205.98
🔹 **Stop Loss:** 82,376.76
🔹 **Final Target:** 80,572.94
**Key Levels:**
🔸 **Major Support:** 80,572.94
🔸 **Major Resistances:** 84,203.62 and 84,550.93
💡 Paying attention to the overall market trend and price reactions to key levels is crucial. In this strategy, **half of the trade volume should be closed at TP1** to secure profits and manage risk effectively.

Feragatname
Bilgiler ve yayınlar, TradingView tarafından sağlanan veya onaylanan finansal, yatırım, alım satım veya diğer türden tavsiye veya öneriler anlamına gelmez ve teşkil etmez. Kullanım Koşulları bölümünde daha fazlasını okuyun.
Feragatname
Bilgiler ve yayınlar, TradingView tarafından sağlanan veya onaylanan finansal, yatırım, alım satım veya diğer türden tavsiye veya öneriler anlamına gelmez ve teşkil etmez. Kullanım Koşulları bölümünde daha fazlasını okuyun.