
Hi everyone.
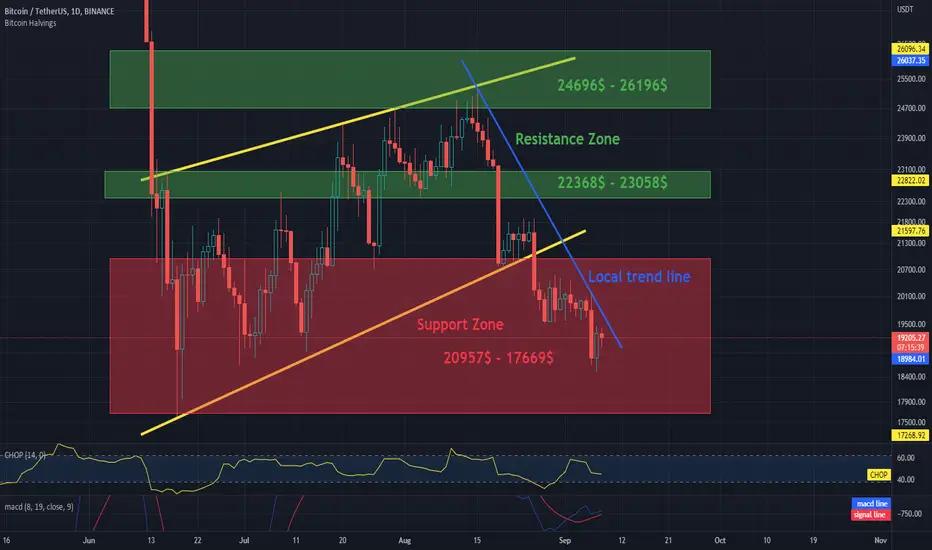
Today we have marked an uptrend channel with yellow lines, which has been broken downwards and now the price is below the local downtrend line.
As you can see, we have an important support zone:
- support zone, where the BTC price is currently from $ 20,957 to $ 17,669, if the price drops below the designated zone, we can expect further drops to around $ 12,000.
Then we have the first resistance zone from $ 22,368 to $ 23,058, if we break it, we have a resistance zone from $ 24,696 to $ 26,196. A break from this zone may cause further gains towards the resistance at $ 28,754.
Also noteworthy is the CHOP indicator, which indicates that most of the energy has been used, and the MACD indicator, which indicates that at this moment we have broken the downward trend and we are in an uptrend locally.

Feragatname
Bilgiler ve yayınlar, TradingView tarafından sağlanan veya onaylanan finansal, yatırım, alım satım veya diğer türden tavsiye veya öneriler anlamına gelmez ve teşkil etmez. Kullanım Koşulları bölümünde daha fazlasını okuyun.
Feragatname
Bilgiler ve yayınlar, TradingView tarafından sağlanan veya onaylanan finansal, yatırım, alım satım veya diğer türden tavsiye veya öneriler anlamına gelmez ve teşkil etmez. Kullanım Koşulları bölümünde daha fazlasını okuyun.