
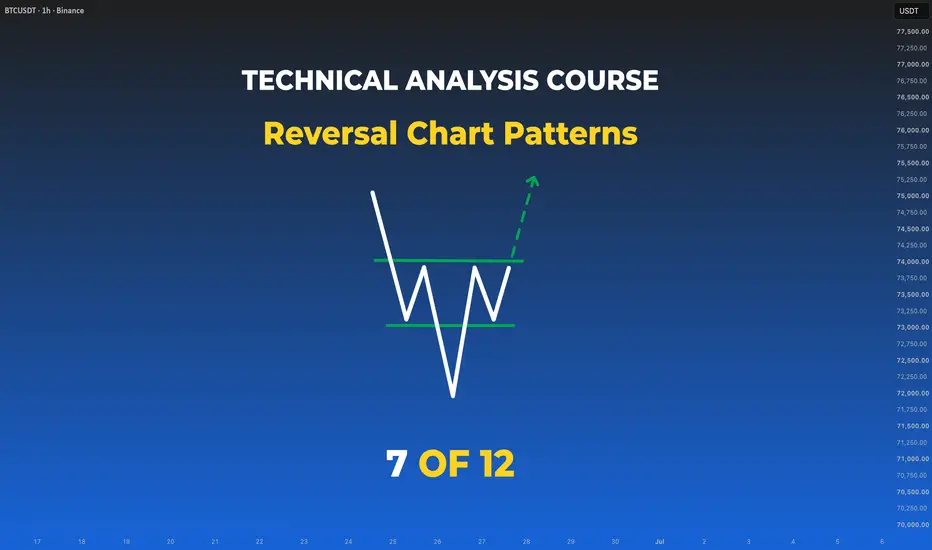
Lesson 7 - Reversal Chart Patterns: How Trends End
Difficulty: (Beginner–Intermediate)
Many major trend reversals leave recognizable structures on the chart — shapes that professionals have been reading for a century. Head & Shoulders, Double Tops, Triple Tops, and Rounding patterns are the classical reversal formations. Learn to recognize them early, and you can prepare for possible trend changes with more structure.

🔵 RECAP — WHERE WE LEFT OFF
In Lesson 6, you learned multi-candle reversal patterns — Engulfing, Stars, Three Soldiers. Those are small, precise signals. Now we zoom out to the big structural shapes that unfold over weeks or months and often mark the end of entire trends.
🔵 WHY CHART PATTERNS MATTER MORE THAN CANDLES
A candle pattern shows a moment. A chart pattern shows a shift in market psychology over time.
When a trend has run for months, the market rarely reverses in one candle. It often builds a shape — usually 3 or more swings — that can signal distribution or accumulation is happening. That shape is your early warning.
🐳 Pro Tip: A weekly Head & Shoulders can signal a larger shift than the same pattern on a 5-minute chart. The bigger the timeframe, the more meaningful the potential move.
🔵 1. HEAD & SHOULDERS — THE KING OF REVERSALS
One of the most widely followed reversal patterns in classical TA.

Structure (bearish reversal at trend top):
Confirmation: pattern completes when price closes below the neckline.
Target: measure the distance from the top of the head to the neckline. Project that same distance downward from the neckline break.
Inverted Head & Shoulders — same structure mirrored, at the bottom of a downtrend. Bullish reversal.
🐳 Pro Tip: The right shoulder should typically stay below the head. If it makes a new high, the pattern is often invalidated.
🔵 2. DOUBLE TOP & DOUBLE BOTTOM
Two failed attempts at the same extreme. Simple, common, and widely used.

Double Top (Bearish Reversal): price rallies to a high, pulls back, rallies to the same high, and fails again. The pullback low between the two peaks is the neckline.
Double Bottom (Bullish Reversal): mirror image at a support level.
Confirmation: pattern completes when price closes beyond the neckline.
Target: measure the distance from the peak (or trough) to the neckline. Project that distance beyond the break.
🐳 Pro Tip: The two peaks (or bottoms) should be near-identical in price. If the second one is significantly higher/lower, it may not be a Double Top — the trend could still be continuing.
🔵 3. TRIPLE TOP & TRIPLE BOTTOM
Three failed attempts instead of two. Rarer than doubles, but often carry more weight when they appear.
Structure and target measurement follow the same logic as Double Tops/Bottoms — just one more rejection at the level.
🐳 Pro Tip: A Triple Top can sometimes convert into a Descending Triangle (which you'll see in Lesson 8 on Continuation Patterns) if it breaks the neckline hard.
🔵 4. ROUNDING TOP & ROUNDING BOTTOM
The slowest, quietest reversal pattern — and often the cleanest when confirmed.

Rounding Bottom (Bullish, aka "Saucer"): a smooth, arc-shaped bottom. Sellers slowly lose control, buyers slowly take over. When the pattern completes and breaks the neckline, the ensuing rally can be powerful.
Rounding Top: mirror image at a market top. Slow distribution, then a decisive break down.
🐳 Pro Tip: Rounding patterns are often overlooked because they take time to form, but they can provide cleaner structural context when confirmed.
🔵 5. HOW TO TRADE ANY REVERSAL PATTERN

The universal 4-step process:
Entry styles:
Stop loss: just beyond the pattern's extreme (below the head in this Inverted H&S example).
Reward zone: once the breakout is confirmed, price can run well beyond the neckline — the chart above shows a real Inverted H&S at the 2022 BTC bottom, where the valid breakout above the neckline was followed by a multi-month rally.
🔵 6. COMMON BEGINNER MISTAKES
🔵 7. YOUR REVERSAL PATTERN FRAMEWORK
Before acting on any reversal pattern, ask:
🔵 QUICK SELF-CHECK
🔵 WHAT IS NEXT
Lesson 8 — Continuation Chart Patterns: reversal patterns can mark the end of trends. Continuation patterns can help traders structure trend-following entries with clearer context. We will cover Flags, Pennants, Triangles (Symmetric / Ascending / Descending), Rectangles, and Wedges.
Drop a comment: which reversal pattern do you find easiest to identify — Head & Shoulders, Double Top, or Rounding?
Full Trading Roadmap | Classical TA Course
Trading Roadmap | Classical TA · Lesson 01 — Mastering the Chart
Trading Roadmap | Classical TA · Lesson 02 — Mastering Trends
Trading Roadmap | Classical TA · Lesson 03 — Support & Resistance
Trading Roadmap | Classical TA · Lesson 04 — Price Channels
Trading Roadmap | Classical TA · Lesson 05 — Single Candle Patterns
Trading Roadmap | Classical TA · Lesson 06 — Multi-Candle Patterns
Best Regards, BigBeluga 🐳
Difficulty: (Beginner–Intermediate)
Many major trend reversals leave recognizable structures on the chart — shapes that professionals have been reading for a century. Head & Shoulders, Double Tops, Triple Tops, and Rounding patterns are the classical reversal formations. Learn to recognize them early, and you can prepare for possible trend changes with more structure.
🔵 RECAP — WHERE WE LEFT OFF
In Lesson 6, you learned multi-candle reversal patterns — Engulfing, Stars, Three Soldiers. Those are small, precise signals. Now we zoom out to the big structural shapes that unfold over weeks or months and often mark the end of entire trends.
🔵 WHY CHART PATTERNS MATTER MORE THAN CANDLES
A candle pattern shows a moment. A chart pattern shows a shift in market psychology over time.
When a trend has run for months, the market rarely reverses in one candle. It often builds a shape — usually 3 or more swings — that can signal distribution or accumulation is happening. That shape is your early warning.
🐳 Pro Tip: A weekly Head & Shoulders can signal a larger shift than the same pattern on a 5-minute chart. The bigger the timeframe, the more meaningful the potential move.
🔵 1. HEAD & SHOULDERS — THE KING OF REVERSALS
One of the most widely followed reversal patterns in classical TA.
Structure (bearish reversal at trend top):
- Left Shoulder — a peak followed by a pullback
- Head — a higher peak (the highest of the three)
- Right Shoulder — a lower peak roughly at the level of the left shoulder
- Neckline — the line connecting the two pullback lows between the peaks
Confirmation: pattern completes when price closes below the neckline.
Target: measure the distance from the top of the head to the neckline. Project that same distance downward from the neckline break.
Inverted Head & Shoulders — same structure mirrored, at the bottom of a downtrend. Bullish reversal.
🐳 Pro Tip: The right shoulder should typically stay below the head. If it makes a new high, the pattern is often invalidated.
🔵 2. DOUBLE TOP & DOUBLE BOTTOM
Two failed attempts at the same extreme. Simple, common, and widely used.
Double Top (Bearish Reversal): price rallies to a high, pulls back, rallies to the same high, and fails again. The pullback low between the two peaks is the neckline.
Double Bottom (Bullish Reversal): mirror image at a support level.
Confirmation: pattern completes when price closes beyond the neckline.
Target: measure the distance from the peak (or trough) to the neckline. Project that distance beyond the break.
🐳 Pro Tip: The two peaks (or bottoms) should be near-identical in price. If the second one is significantly higher/lower, it may not be a Double Top — the trend could still be continuing.
🔵 3. TRIPLE TOP & TRIPLE BOTTOM
Three failed attempts instead of two. Rarer than doubles, but often carry more weight when they appear.
Structure and target measurement follow the same logic as Double Tops/Bottoms — just one more rejection at the level.
🐳 Pro Tip: A Triple Top can sometimes convert into a Descending Triangle (which you'll see in Lesson 8 on Continuation Patterns) if it breaks the neckline hard.
🔵 4. ROUNDING TOP & ROUNDING BOTTOM
The slowest, quietest reversal pattern — and often the cleanest when confirmed.
Rounding Bottom (Bullish, aka "Saucer"): a smooth, arc-shaped bottom. Sellers slowly lose control, buyers slowly take over. When the pattern completes and breaks the neckline, the ensuing rally can be powerful.
Rounding Top: mirror image at a market top. Slow distribution, then a decisive break down.
🐳 Pro Tip: Rounding patterns are often overlooked because they take time to form, but they can provide cleaner structural context when confirmed.
🔵 5. HOW TO TRADE ANY REVERSAL PATTERN
The universal 4-step process:
- Identify the pattern as it develops — after the head forms (for H&S), or after the second peak/trough (for Doubles)
- Draw the neckline connecting the reaction points
- Wait for a close beyond the neckline — the pattern is not confirmed until then
- Choose your entry style — see below
Entry styles:
- Aggressive traders may enter on a decisive close beyond the neckline.
- Conservative traders often wait for a retest of the neckline before entering.
Stop loss: just beyond the pattern's extreme (below the head in this Inverted H&S example).
Reward zone: once the breakout is confirmed, price can run well beyond the neckline — the chart above shows a real Inverted H&S at the 2022 BTC bottom, where the valid breakout above the neckline was followed by a multi-month rally.
🔵 6. COMMON BEGINNER MISTAKES
- Trading the pattern before the neckline breaks (anticipation)
- Ignoring the higher-timeframe trend — a bearish reversal pattern inside a stronger uptrend can often fail
- Confusing a Double Top with a healthy pullback in an uptrend
- Not measuring the target and holding trades without a plan
- Trading small chart patterns on 1m or 5m — they can be less reliable there
- Entering without deciding whether you're playing the break or the retest
🔵 7. YOUR REVERSAL PATTERN FRAMEWORK
Before acting on any reversal pattern, ask:
- Is the pattern at the end of an extended trend?
- Has the neckline been broken with a body close and follow-through?
- Where is the projected target — and does it justify the risk?
- Does the higher timeframe agree with the reversal?
🔵 QUICK SELF-CHECK
- Identify a Head & Shoulders vs an Inverted H&S
- Draw a neckline on any Double Top or Bottom
- Measure a target from the pattern's height
- Explain why Rounding patterns take longer but can produce cleaner structural moves
- Choose your entry style — break vs retest — and defend the choice
🔵 WHAT IS NEXT
Lesson 8 — Continuation Chart Patterns: reversal patterns can mark the end of trends. Continuation patterns can help traders structure trend-following entries with clearer context. We will cover Flags, Pennants, Triangles (Symmetric / Ascending / Descending), Rectangles, and Wedges.
Drop a comment: which reversal pattern do you find easiest to identify — Head & Shoulders, Double Top, or Rounding?
Full Trading Roadmap | Classical TA Course
Trading Roadmap | Classical TA · Lesson 01 — Mastering the Chart
Trading Roadmap | Classical TA · Lesson 02 — Mastering Trends
Trading Roadmap | Classical TA · Lesson 03 — Support & Resistance
Trading Roadmap | Classical TA · Lesson 04 — Price Channels
Trading Roadmap | Classical TA · Lesson 05 — Single Candle Patterns
Trading Roadmap | Classical TA · Lesson 06 — Multi-Candle Patterns
Best Regards, BigBeluga 🐳

🌐 bigbeluga.org/tv - Get access to our powerful tools & indicators.
🔵 Learn More -> docs.bigbeluga.org/
🔵 Join Discord -> go.bigbeluga.org/k65q9bfqfu
All content provided by BigBeluga is for educational purposes only
🔵 Learn More -> docs.bigbeluga.org/
🔵 Join Discord -> go.bigbeluga.org/k65q9bfqfu
All content provided by BigBeluga is for educational purposes only
İlgili yayınlar
Feragatname
Bilgiler ve yayınlar, TradingView tarafından sağlanan veya onaylanan finansal, yatırım, alım satım veya diğer türden tavsiye veya öneriler anlamına gelmez ve teşkil etmez. Kullanım Koşulları bölümünde daha fazlasını okuyun.