
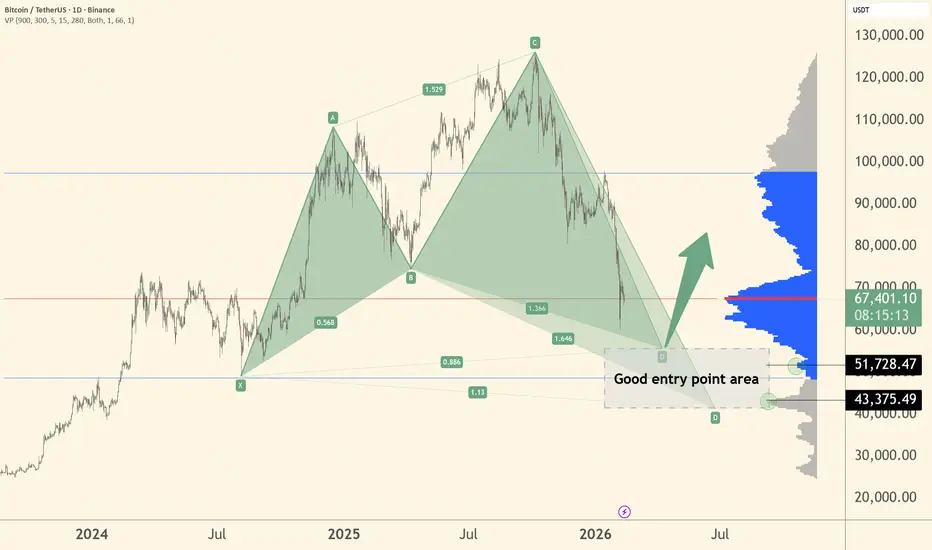
This is a BTC daily chart showing a Shark harmonic pattern forming.
Price moved in a large 5-point structure labeled X → A → B → C → D.
We are now approaching point D, which is the potential reversal zone. That zone is defined between the 0,886 and 1,13 Fib ratios.
The highlighted grey box (around $43k–$52k) is marked as a “good entry point area”.
This is where the pattern suggests BTC could find support and potentially reverse upward.
On the right side, the blue/grey volume profile shows strong historical trading activity in this zone — which adds confluence. My targets would be at aprox. 51800 and 43400.
TL;DR:
BTC is correcting into a strong support + harmonic completion zone, where a bounce could happen.
Price moved in a large 5-point structure labeled X → A → B → C → D.
We are now approaching point D, which is the potential reversal zone. That zone is defined between the 0,886 and 1,13 Fib ratios.
The highlighted grey box (around $43k–$52k) is marked as a “good entry point area”.
This is where the pattern suggests BTC could find support and potentially reverse upward.
On the right side, the blue/grey volume profile shows strong historical trading activity in this zone — which adds confluence. My targets would be at aprox. 51800 and 43400.
TL;DR:
BTC is correcting into a strong support + harmonic completion zone, where a bounce could happen.

Feragatname
Bilgiler ve yayınlar, TradingView tarafından sağlanan veya onaylanan finansal, yatırım, alım satım veya diğer türden tavsiye veya öneriler anlamına gelmez ve teşkil etmez. Kullanım Koşulları bölümünde daha fazlasını okuyun.
Feragatname
Bilgiler ve yayınlar, TradingView tarafından sağlanan veya onaylanan finansal, yatırım, alım satım veya diğer türden tavsiye veya öneriler anlamına gelmez ve teşkil etmez. Kullanım Koşulları bölümünde daha fazlasını okuyun.