
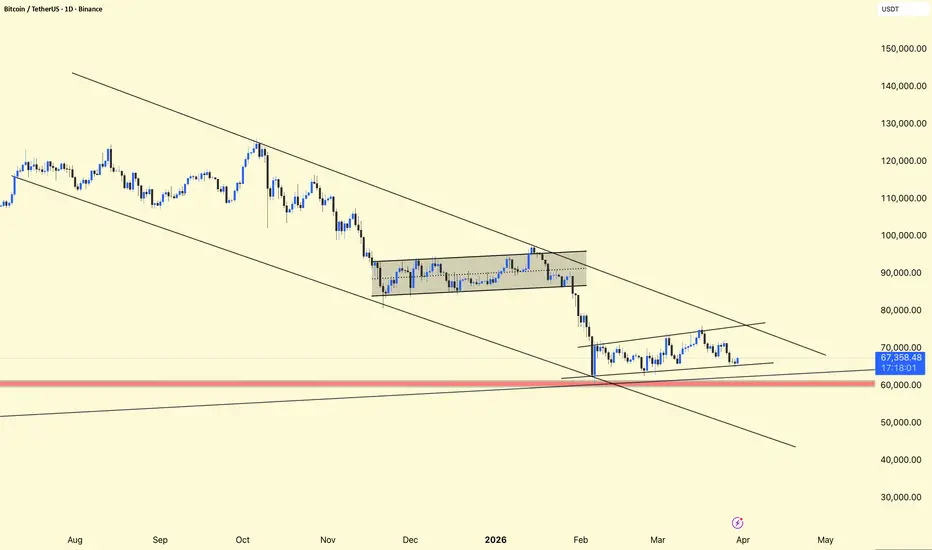
BTCUSDT – Daily Chart Update
Current Structure Price: ~$67.3K
Trading just above major support (~$60K–$62K zone)
Still inside a larger descending channel
Short-term forming a tight consolidation range
Market is compressing after a sharp drop — decision phase
Breakdown from previous range → strong sell-off
Now forming a bear flag / weak recovery structure
Lower highs still intact → trend remains bearish
Bearish Continuation (more likely currently)
Rejection from the $70K area
Break below $60K
Targets:
$55K
Possibly lower if momentum builds
Bullish Reversal (needs confirmation)
Break & hold above $72K
Invalidate the lower high structure
Then move toward:
$78K → $80K
👉 Still bearish until $72K is reclaimed

İlgili yayınlar
Feragatname
Bilgiler ve yayınlar, TradingView tarafından sağlanan veya onaylanan finansal, yatırım, alım satım veya diğer türden tavsiye veya öneriler anlamına gelmez ve teşkil etmez. Kullanım Koşulları bölümünde daha fazlasını okuyun.
İlgili yayınlar
Feragatname
Bilgiler ve yayınlar, TradingView tarafından sağlanan veya onaylanan finansal, yatırım, alım satım veya diğer türden tavsiye veya öneriler anlamına gelmez ve teşkil etmez. Kullanım Koşulları bölümünde daha fazlasını okuyun.