
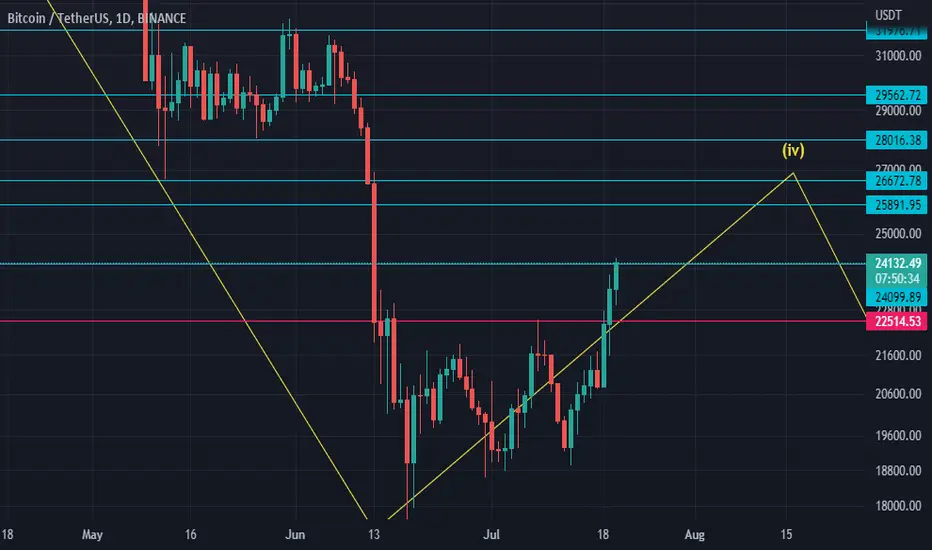
This is how I see BTC short-med-long term
as you see in the chart above I think BTC is in its 4th wave
mostly reverse around 0.38 fibo =~25700
I put other levels the price could reach
in this chart down, you can see the whole wave + the parallel channel

*
*
In this one, you can see the double-top and his target, reclaiming the nick-line is strongly bullish

*
*
there you can see USDT dominance targets and the potential reverse up to 10%

*
*
also, DXY is still bullish, as I mentioned before his targeting 112

*
conclusion, short-term bullish /mid-term bearish /long-term bullish
that could change if I saw a good move in the chart or if the price reclaimed important resistance like 28600 and 32000
I have other reasons to be bearish ( economic conditions )
boost this idea if you like it
as you see in the chart above I think BTC is in its 4th wave
mostly reverse around 0.38 fibo =~25700
I put other levels the price could reach
in this chart down, you can see the whole wave + the parallel channel
*
*
In this one, you can see the double-top and his target, reclaiming the nick-line is strongly bullish
*
*
there you can see USDT dominance targets and the potential reverse up to 10%
*
*
also, DXY is still bullish, as I mentioned before his targeting 112
*
conclusion, short-term bullish /mid-term bearish /long-term bullish
that could change if I saw a good move in the chart or if the price reclaimed important resistance like 28600 and 32000
I have other reasons to be bearish ( economic conditions )
boost this idea if you like it

İlgili yayınlar
Feragatname
Bilgiler ve yayınlar, TradingView tarafından sağlanan veya onaylanan finansal, yatırım, alım satım veya diğer türden tavsiye veya öneriler anlamına gelmez ve teşkil etmez. Kullanım Koşulları bölümünde daha fazlasını okuyun.
İlgili yayınlar
Feragatname
Bilgiler ve yayınlar, TradingView tarafından sağlanan veya onaylanan finansal, yatırım, alım satım veya diğer türden tavsiye veya öneriler anlamına gelmez ve teşkil etmez. Kullanım Koşulları bölümünde daha fazlasını okuyun.