
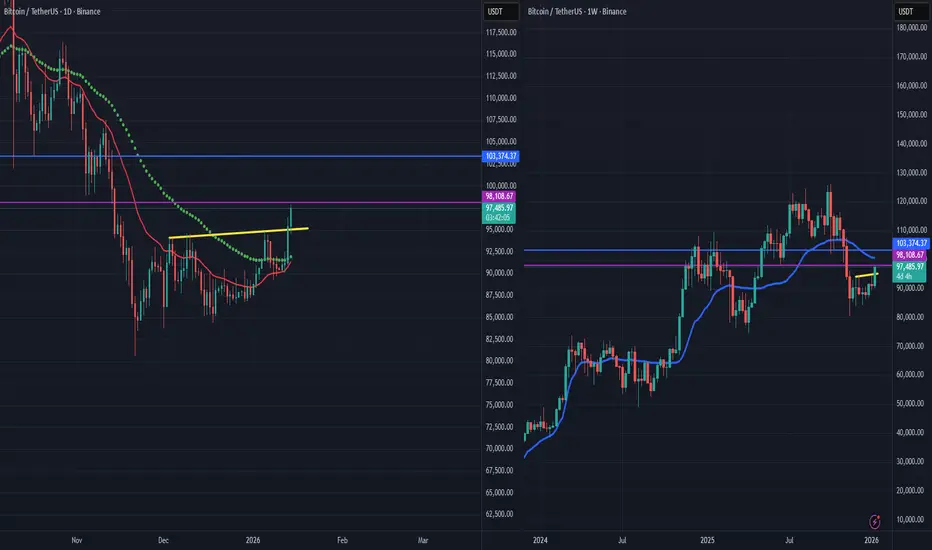
The chart shows an inverse head and shoulders pattern, but as long as we stay above the yellow line, the direction is upward. The first target of the formation is the 98,108 level, which corresponds to the 1.414 Fibonacci retracement of the breakout, with the main target being around 103,000. Pay attention to the Kaufman indicator on the weekly timeframe as an intermediate resistance level.

Feragatname
Bilgiler ve yayınlar, TradingView tarafından sağlanan veya onaylanan finansal, yatırım, alım satım veya diğer türden tavsiye veya öneriler anlamına gelmez ve teşkil etmez. Kullanım Koşulları bölümünde daha fazlasını okuyun.
Feragatname
Bilgiler ve yayınlar, TradingView tarafından sağlanan veya onaylanan finansal, yatırım, alım satım veya diğer türden tavsiye veya öneriler anlamına gelmez ve teşkil etmez. Kullanım Koşulları bölümünde daha fazlasını okuyun.