
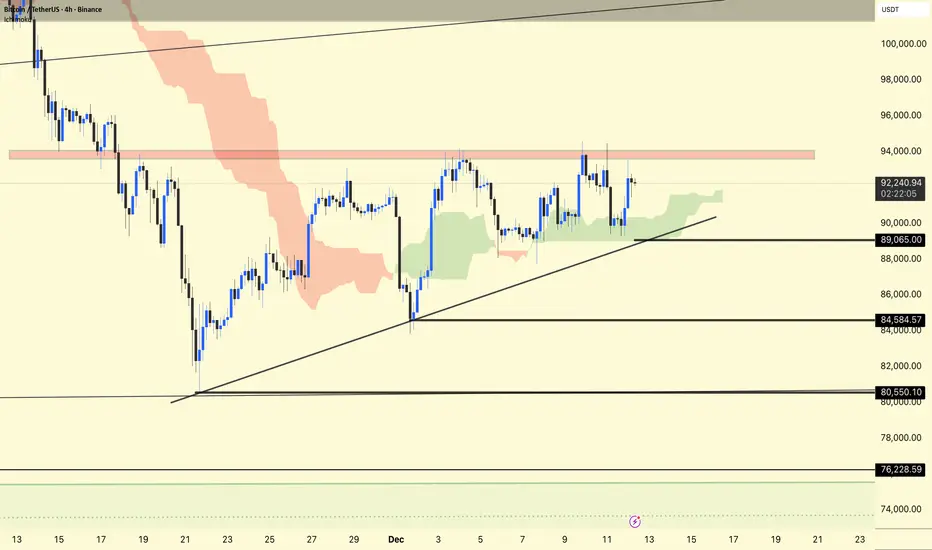
the 4H chart, BTCUSDT is consolidating in a tight range, holding above a rising trendline, while repeatedly rejecting from the same 93,500–94,500 resistance block.
The price is trading near rising support from the Ichimoku Cloud and lows of 82,000–83,000. Local horizontal support is now around 89,000–89,100, and if the trendline fails, deeper support is at 84,584 and 80,550.
As long as candles close above the trendline and 89,000, the setup favors another attempt to break the red resistance band; a clean 4H close above 94.5k would create room for a move towards 96,000–100,000.
A decisive break below the diagonal plus 89k level reveals a move first to 84.5k and then to 80.5k, where the larger, higher-timeframe demand zone and previous bounce began.
DYOR | NFA
The price is trading near rising support from the Ichimoku Cloud and lows of 82,000–83,000. Local horizontal support is now around 89,000–89,100, and if the trendline fails, deeper support is at 84,584 and 80,550.
As long as candles close above the trendline and 89,000, the setup favors another attempt to break the red resistance band; a clean 4H close above 94.5k would create room for a move towards 96,000–100,000.
A decisive break below the diagonal plus 89k level reveals a move first to 84.5k and then to 80.5k, where the larger, higher-timeframe demand zone and previous bounce began.
DYOR | NFA

İlgili yayınlar
Feragatname
Bilgiler ve yayınlar, TradingView tarafından sağlanan veya onaylanan finansal, yatırım, alım satım veya diğer türden tavsiye veya öneriler anlamına gelmez ve teşkil etmez. Kullanım Koşulları bölümünde daha fazlasını okuyun.
İlgili yayınlar
Feragatname
Bilgiler ve yayınlar, TradingView tarafından sağlanan veya onaylanan finansal, yatırım, alım satım veya diğer türden tavsiye veya öneriler anlamına gelmez ve teşkil etmez. Kullanım Koşulları bölümünde daha fazlasını okuyun.