
Hello, this is my first idea ever in trading view. I hope this idea is useful for you all.
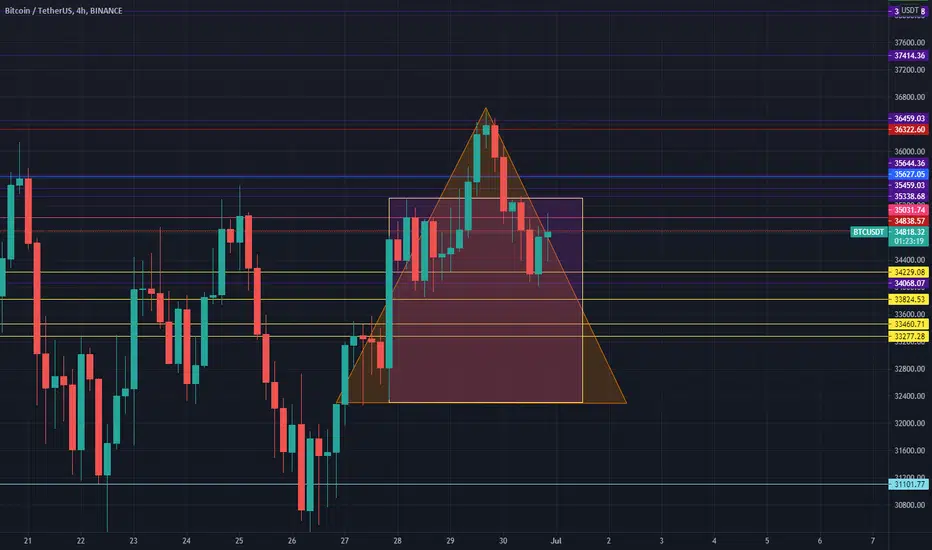
As you can see, I draw a triangle and a square for the highest peak which was 36640 and lowest 32300. Most probably the candles will follow the triangle drop and it should not go outside the square area. In case it did it might raise again.
I hope you like my humble analysis.
thanks,
As you can see, I draw a triangle and a square for the highest peak which was 36640 and lowest 32300. Most probably the candles will follow the triangle drop and it should not go outside the square area. In case it did it might raise again.
I hope you like my humble analysis.
thanks,

Feragatname
Bilgiler ve yayınlar, TradingView tarafından sağlanan veya onaylanan finansal, yatırım, alım satım veya diğer türden tavsiye veya öneriler anlamına gelmez ve teşkil etmez. Kullanım Koşulları bölümünde daha fazlasını okuyun.
Feragatname
Bilgiler ve yayınlar, TradingView tarafından sağlanan veya onaylanan finansal, yatırım, alım satım veya diğer türden tavsiye veya öneriler anlamına gelmez ve teşkil etmez. Kullanım Koşulları bölümünde daha fazlasını okuyun.