
Hi everyone. This is the very first analysis I'm publishing here.
Let's dive into Bitcoin and perform a multi-timeframe analysis.
Monthly Timeframe
Starting with the monthly chart, we are currently in a strong bearish leg. Before considering any spot buying on this timeframe, we need to wait for a strong reversal candle. In the last closed candle, price dropped straight into a pre-existing support zone. Now, we have to wait and see how the July candle structured itself over the next 26 days.
Weekly Timeframe
On the weekly chart, we can see a clean downtrend with clearly visible lower highs and lower lows. Furthermore, since price has broken below the $66,270 support, we can expect it to pay a visit to the $53,550 level.
For a spot entry on the weekly timeframe, we can look at a few scenarios:
Price drops to $53,550, forms an accumulation zone, and we enter on a clean upside breakout of that range.
Price moves up and breaks above the last major swing high at $82,120, confirming a trend reversal.
Price begins to form a new trend right from current levels, establishing a bottom and creating a new high before reaching $82,120. Then, on the subsequent higher low, we enter our spot position once it breaks that newly formed local high.
Daily Timeframe
Moving on to the daily timeframe, after getting rejected from the $82,275 peak, price started a sharp bearish leg, followed by an upside retracement to $66,516 where it got rejected again. However, this second drop wasn't as aggressive as the previous one, bottoming out at $58,294 before initiating another upward retracement.
To wrap things up before looking at lower timeframes for execution: our monthly and weekly views are bearish, and the daily is also bearish but showing signs of trend exhaustion.
4-Hour & 1-Hour Timeframes (Execution)
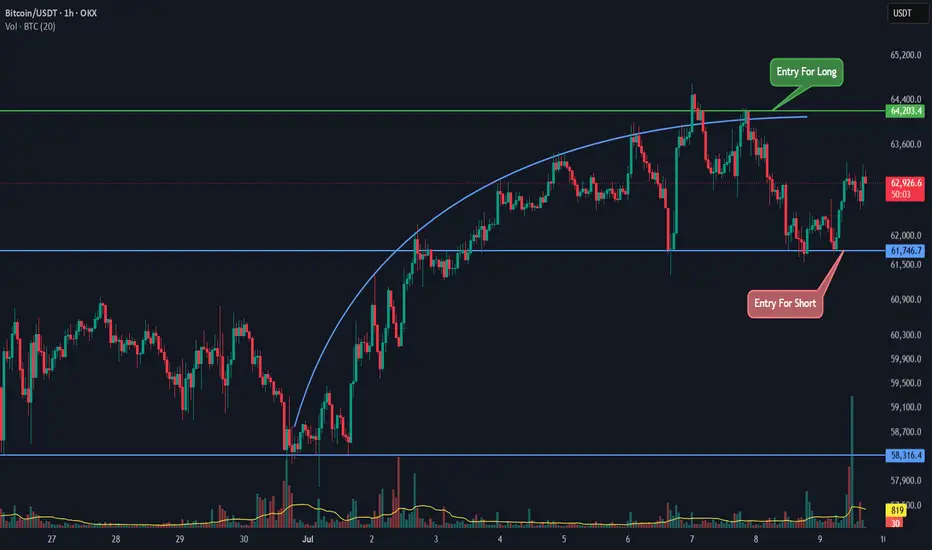
On the 4-hour chart, after bouncing from $58,316 to $64,135, we can see a noticeable momentum loss in the bullish move. If you look closely, the slope of the move has rounded off into a semi-circle. Since our 1-hour entries are based on the 4-hour trend direction, we can map out our long and short triggers.
Long Scenario: If price closes above $64,203.4, it will have broken its last 4-hour swing high while printing a higher low. This signals a potential bullish shift on the 4-hour chart. Once price reacts to $64,203.4 and forms a higher low that offers a tight, logical stop loss, we can look for an entry. We will trigger the long position on a retest (second touch or later), specifically when a candle closes above resistance accompanied by breakout volume higher than the 20 MA.
Short Scenario: To trade in line with the current 4-hour bearish trend, we wait for the 1-hour timeframe. Once price reacts to $61,746.7, prints a lower high, and breaks our support line with candle volume exceeding the 20 MA, we will enter a short position, placing the stop loss just above the newly formed swing high.
I hope you enjoyed this analysis and find it useful. As always, make sure to prioritize your risk and money management!

Feragatname
Bilgiler ve yayınlar, TradingView tarafından sağlanan veya onaylanan finansal, yatırım, alım satım veya diğer türden tavsiye veya öneriler anlamına gelmez ve teşkil etmez. Kullanım Koşulları bölümünde daha fazlasını okuyun.
Feragatname
Bilgiler ve yayınlar, TradingView tarafından sağlanan veya onaylanan finansal, yatırım, alım satım veya diğer türden tavsiye veya öneriler anlamına gelmez ve teşkil etmez. Kullanım Koşulları bölümünde daha fazlasını okuyun.