
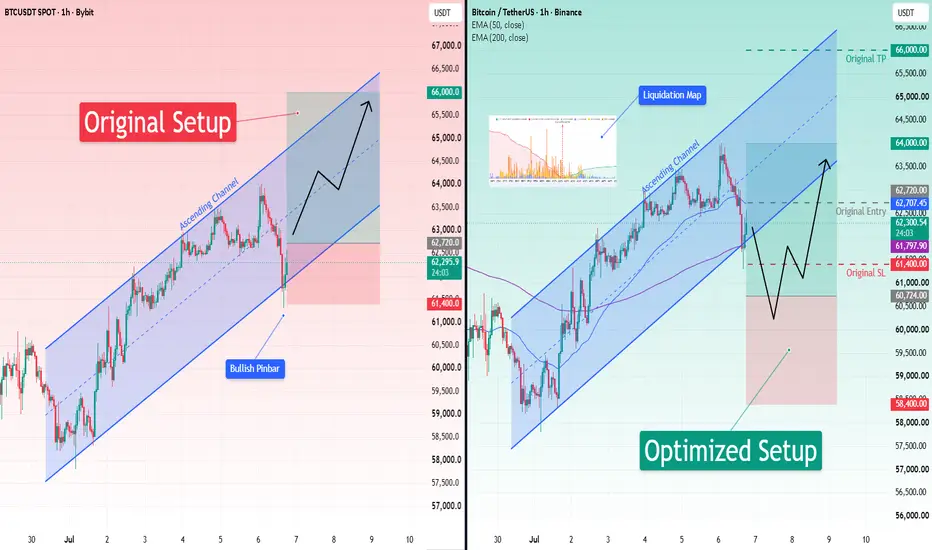
I am stress-testing a raw long setup today. The core idea enters an ascending channel bounce confirmed by a bullish pin bar. The parameters sit at a 62,720 entry, 66,000 take-profit, and 61,400 stop-loss. My goal is optimizing these levels with EMA and liquidation map data.
💡 IDEA
The original idea is a continuation long above the current price.
This completely ignores the overwhelming bearish market bias. With a 3.86 imbalance ratio and 2.07 billion in long liquidation risk compared to just 534 million in shorts, buying at these current levels essentially volunteers your capital as exit liquidity.
The optimized idea waits for a deep liquidity sweep. The focus is letting market makers hunt overleveraged longs before stepping in.
🛫 ENTRY
Placing the original entry at 62,720 was extremely dangerous.
It meant buying directly into the dynamic resistance of the falling EMA 50 at 62,716 and straight into a heavy resistance cluster.
To fix this, the entry was moved down to 60,724. This specific level sits at the exact core of a colossal 956.41M support cluster.
The entire setup is strictly invalidated if a 1H candle prints a close above 64,674 before the optimized entry triggers. Clearing that first resistance block beforehand would completely shift the local market structure and render the current liquidity map obsolete.
💰 TAKE-PROFIT
The original take-profit of 66,000 expects a massive breakout past multiple heavy resistance zones.
This is highly unrealistic given the heavy bearish market bias and the recent downtrend.
The take-profit was lowered to 64,000 to secure a much safer, higher-probability target that perfectly aligns with front-running the previous 24H high and cleanly clears the bulk of the immediate overhead resistance cluster.
Trapped shorts will be forced to buy to cover, providing the exact liquidity needed to exit safely.
🛡️ STOP-LOSS
The original stop-loss was arguably the most fatal flaw.
Setting it at 61,400 placed it precisely inside the densest liquidation zone, guaranteeing it would be hunted by market makers.
The stop-loss was widened to 58,400 to safely tuck the risk beneath the cascading liquidity pools of the lower support clusters.
If the price action aggressively falls below the 58,400 level, it means the cascade failed to bounce and the market is directly targeting the 30-day major swing low of 57,793, which fully invalidates the underlying bullish thesis.
⚖️ RISK-TO-REWARD
The original setup offered a 1:2.48 risk-to-reward ratio.
This was pure fantasy because the tight stop-loss was mathematically guaranteed to be swept by the algorithm.
The parameters were adjusted to reflect a realistic 1:1.41 ratio.
Widening the stop-loss to survive the inevitable long squeeze and lowering the entry point transforms a highly fragile setup with a near zero percent win probability into a highly viable, data-backed swing trade.
It will be interesting to see which setup actually performs better in the live market.
💡 IDEA
The original idea is a continuation long above the current price.
This completely ignores the overwhelming bearish market bias. With a 3.86 imbalance ratio and 2.07 billion in long liquidation risk compared to just 534 million in shorts, buying at these current levels essentially volunteers your capital as exit liquidity.
The optimized idea waits for a deep liquidity sweep. The focus is letting market makers hunt overleveraged longs before stepping in.
🛫 ENTRY
Placing the original entry at 62,720 was extremely dangerous.
It meant buying directly into the dynamic resistance of the falling EMA 50 at 62,716 and straight into a heavy resistance cluster.
To fix this, the entry was moved down to 60,724. This specific level sits at the exact core of a colossal 956.41M support cluster.
The entire setup is strictly invalidated if a 1H candle prints a close above 64,674 before the optimized entry triggers. Clearing that first resistance block beforehand would completely shift the local market structure and render the current liquidity map obsolete.
💰 TAKE-PROFIT
The original take-profit of 66,000 expects a massive breakout past multiple heavy resistance zones.
This is highly unrealistic given the heavy bearish market bias and the recent downtrend.
The take-profit was lowered to 64,000 to secure a much safer, higher-probability target that perfectly aligns with front-running the previous 24H high and cleanly clears the bulk of the immediate overhead resistance cluster.
Trapped shorts will be forced to buy to cover, providing the exact liquidity needed to exit safely.
🛡️ STOP-LOSS
The original stop-loss was arguably the most fatal flaw.
Setting it at 61,400 placed it precisely inside the densest liquidation zone, guaranteeing it would be hunted by market makers.
The stop-loss was widened to 58,400 to safely tuck the risk beneath the cascading liquidity pools of the lower support clusters.
If the price action aggressively falls below the 58,400 level, it means the cascade failed to bounce and the market is directly targeting the 30-day major swing low of 57,793, which fully invalidates the underlying bullish thesis.
⚖️ RISK-TO-REWARD
The original setup offered a 1:2.48 risk-to-reward ratio.
This was pure fantasy because the tight stop-loss was mathematically guaranteed to be swept by the algorithm.
The parameters were adjusted to reflect a realistic 1:1.41 ratio.
Widening the stop-loss to survive the inevitable long squeeze and lowering the entry point transforms a highly fragile setup with a near zero percent win probability into a highly viable, data-backed swing trade.
It will be interesting to see which setup actually performs better in the live market.

🤖 I optimize my trade setups with this AI Telegram bot (EN/RU):
🔗 t.me/sharkcouncil_bot
🔗 t.me/sharkcouncil_bot
Feragatname
Bilgiler ve yayınlar, TradingView tarafından sağlanan veya onaylanan finansal, yatırım, alım satım veya diğer türden tavsiye veya öneriler anlamına gelmez ve teşkil etmez. Kullanım Koşulları bölümünde daha fazlasını okuyun.
🤖 I optimize my trade setups with this AI Telegram bot (EN/RU):
🔗 t.me/sharkcouncil_bot
🔗 t.me/sharkcouncil_bot
Feragatname
Bilgiler ve yayınlar, TradingView tarafından sağlanan veya onaylanan finansal, yatırım, alım satım veya diğer türden tavsiye veya öneriler anlamına gelmez ve teşkil etmez. Kullanım Koşulları bölümünde daha fazlasını okuyun.