
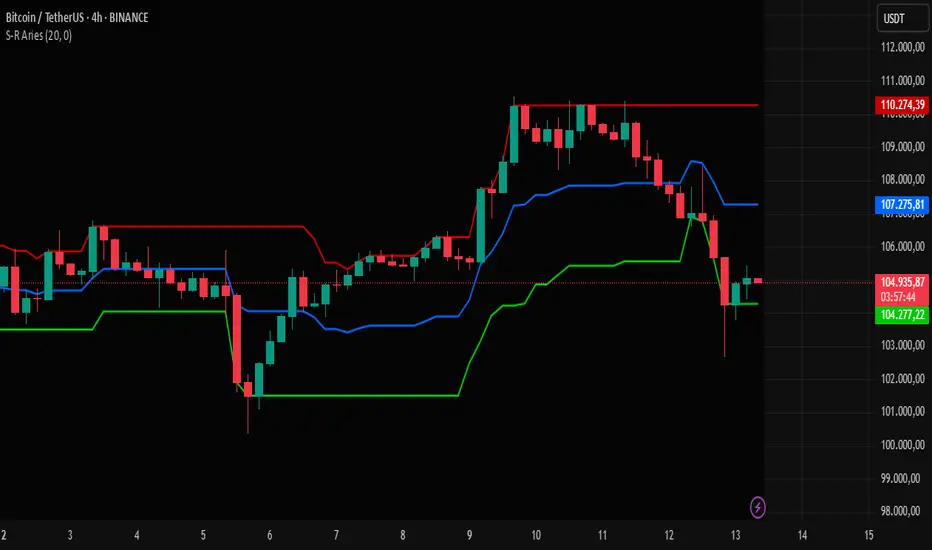
This indicator is designed to identify dynamic levels of support, resistance, and a midpoint based on closing prices over a specific period. It provides a clear visual structure to help traders recognize key areas where the market may react.
How It Works:
Calculation Period:
The user selects the number of candles to analyze for determining the levels. The default value is 20, and it can range from 1 to 200.
Calculations:
Resistance: the highest closing price within the selected period.
Support: the lowest closing price within the same period.
Midline: the simple average between the support and resistance levels.
Chart Display:
Three horizontal lines are plotted directly on the price chart:
Green line for support
Red line for resistance
Blue line for the midpoint
These lines help identify potential zones of:
Reversal
Consolidation
Breakout
Chart Background:
The chart background can be colored using a user-defined color.
The "Background Offset" setting allows this background color to be applied with a delay, avoiding overlap with the most recent candles and keeping the view clean.
Practical Applications:
Useful for trend reversal strategies, breakout setups, or simply analyzing market structure.
Effective across all timeframes, from intraday to weekly charts.
Can be used as a foundation for automated systems like grid bots or breakout alerts.
Visual Style and Usability:
The use of distinct colors (green, red, and blue) ensures quick and clear interpretation.
A clean, minimalistic layout focused on delivering objective information without cluttering the chart.
How It Works:
Calculation Period:
The user selects the number of candles to analyze for determining the levels. The default value is 20, and it can range from 1 to 200.
Calculations:
Resistance: the highest closing price within the selected period.
Support: the lowest closing price within the same period.
Midline: the simple average between the support and resistance levels.
Chart Display:
Three horizontal lines are plotted directly on the price chart:
Green line for support
Red line for resistance
Blue line for the midpoint
These lines help identify potential zones of:
Reversal
Consolidation
Breakout
Chart Background:
The chart background can be colored using a user-defined color.
The "Background Offset" setting allows this background color to be applied with a delay, avoiding overlap with the most recent candles and keeping the view clean.
Practical Applications:
Useful for trend reversal strategies, breakout setups, or simply analyzing market structure.
Effective across all timeframes, from intraday to weekly charts.
Can be used as a foundation for automated systems like grid bots or breakout alerts.
Visual Style and Usability:
The use of distinct colors (green, red, and blue) ensures quick and clear interpretation.
A clean, minimalistic layout focused on delivering objective information without cluttering the chart.

Feragatname
Bilgiler ve yayınlar, TradingView tarafından sağlanan veya onaylanan finansal, yatırım, alım satım veya diğer türden tavsiye veya öneriler anlamına gelmez ve teşkil etmez. Kullanım Koşulları bölümünde daha fazlasını okuyun.
Feragatname
Bilgiler ve yayınlar, TradingView tarafından sağlanan veya onaylanan finansal, yatırım, alım satım veya diğer türden tavsiye veya öneriler anlamına gelmez ve teşkil etmez. Kullanım Koşulları bölümünde daha fazlasını okuyun.