
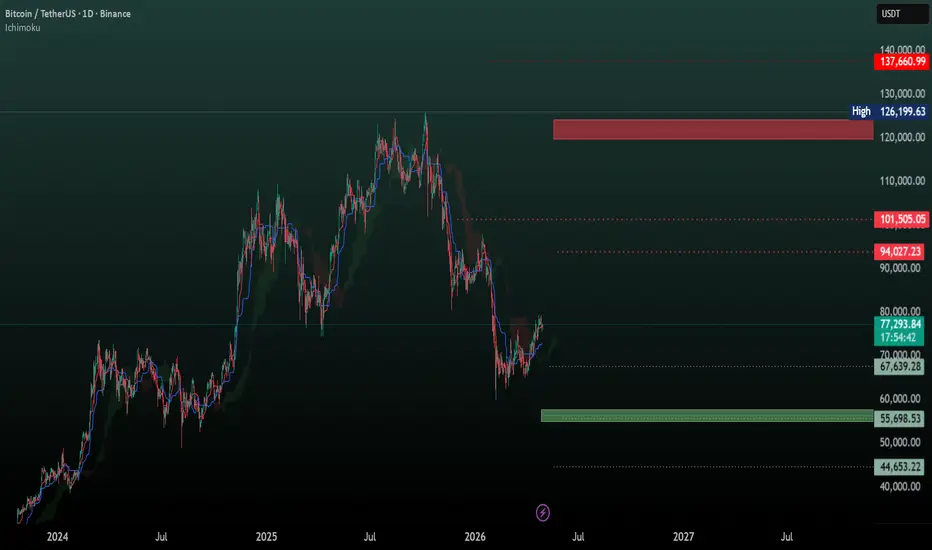
Based on last year's analysis Bitcoin has reached a resistance zone and has entered a correction phase
right now these two levels represent the most important support and resistance areas in the market:
Support zone: 55,600
Resistance zone: 120,000
All the mentioned levels are key zones for Bitcoin, and we trade based on them.
Based on the Ichimoku analysis, Bitcoin is trying to move toward the 94,000 resistance level.
The analysis will be updated after a breakout from any of the mentioned support or resistance zones.
right now these two levels represent the most important support and resistance areas in the market:
Support zone: 55,600
Resistance zone: 120,000
All the mentioned levels are key zones for Bitcoin, and we trade based on them.
Based on the Ichimoku analysis, Bitcoin is trying to move toward the 94,000 resistance level.
The analysis will be updated after a breakout from any of the mentioned support or resistance zones.
Not
The price bounced from a nearby support zone, and this level is still validNot
116 days ago, these levels were plotted on the chart using Ichimoku. Today, you are witnessing the most precise reaction and price reversal from these levels. If this isn’t a work of art in the world of trading, then what is?
Queenichi 👑
Feragatname
Bilgiler ve yayınlar, TradingView tarafından sağlanan veya onaylanan finansal, yatırım, alım satım veya diğer türden tavsiye veya öneriler anlamına gelmez ve teşkil etmez. Kullanım Koşulları bölümünde daha fazlasını okuyun.
Queenichi 👑
Feragatname
Bilgiler ve yayınlar, TradingView tarafından sağlanan veya onaylanan finansal, yatırım, alım satım veya diğer türden tavsiye veya öneriler anlamına gelmez ve teşkil etmez. Kullanım Koşulları bölümünde daha fazlasını okuyun.