
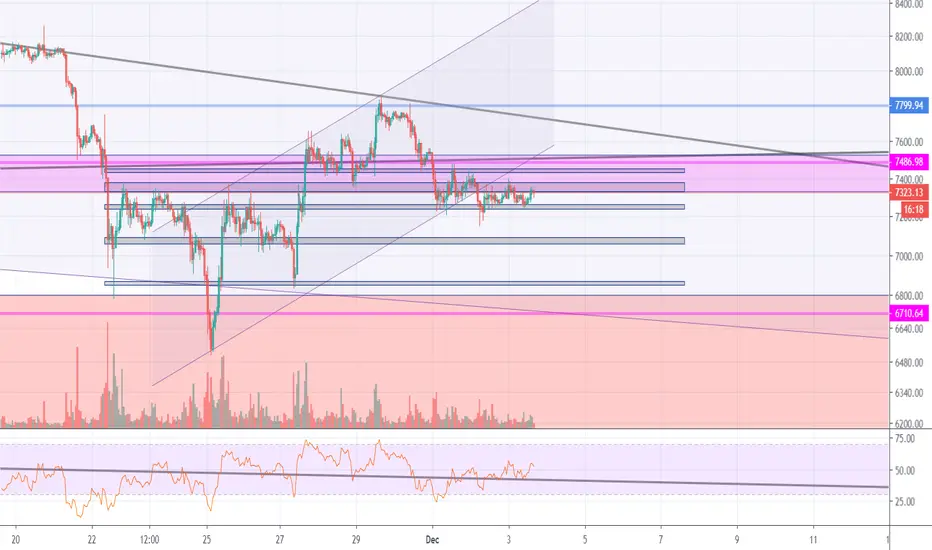
Hey, everybody, I'm the developer of an artificial intelligence buy-sell robot called Mikabot. In the light of the information provided by the new "Channel Bender" module, I added dark horizontal areas to the chart.
You see the dark horizontal areas in the graph.
These areas work as a trend and are the resistance and support of the channels.
The price of Bitcoin will probably find the new direction trapped between these trends.
Let's see what happens.
You see the dark horizontal areas in the graph.
These areas work as a trend and are the resistance and support of the channels.
The price of Bitcoin will probably find the new direction trapped between these trends.
Let's see what happens.

İlgili yayınlar
Feragatname
Bilgiler ve yayınlar, TradingView tarafından sağlanan veya onaylanan finansal, yatırım, alım satım veya diğer türden tavsiye veya öneriler anlamına gelmez ve teşkil etmez. Kullanım Koşulları bölümünde daha fazlasını okuyun.
İlgili yayınlar
Feragatname
Bilgiler ve yayınlar, TradingView tarafından sağlanan veya onaylanan finansal, yatırım, alım satım veya diğer türden tavsiye veya öneriler anlamına gelmez ve teşkil etmez. Kullanım Koşulları bölümünde daha fazlasını okuyun.