
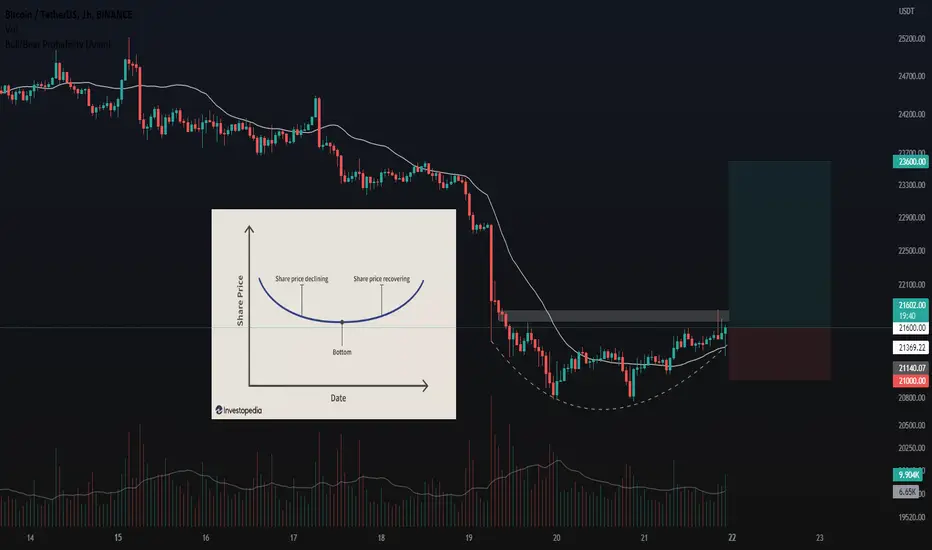
What Is a Rounding Bottom?
A rounding bottom is a chart pattern used in technical analysis and is identified by a series of price movements that graphically form the shape of a "U". Rounding bottoms are found at the end of extended downward trends and signify a reversal in long-term price movements. This pattern's time frame can vary from several weeks to several months and is deemed by many traders as a rare occurrence. Ideally, volume and price will move in tandem, where volume confirms the price action.
-------------
NFA/DYOR.
A rounding bottom is a chart pattern used in technical analysis and is identified by a series of price movements that graphically form the shape of a "U". Rounding bottoms are found at the end of extended downward trends and signify a reversal in long-term price movements. This pattern's time frame can vary from several weeks to several months and is deemed by many traders as a rare occurrence. Ideally, volume and price will move in tandem, where volume confirms the price action.
-------------
NFA/DYOR.

Feragatname
Bilgiler ve yayınlar, TradingView tarafından sağlanan veya onaylanan finansal, yatırım, alım satım veya diğer türden tavsiye veya öneriler anlamına gelmez ve teşkil etmez. Kullanım Koşulları bölümünde daha fazlasını okuyun.
Feragatname
Bilgiler ve yayınlar, TradingView tarafından sağlanan veya onaylanan finansal, yatırım, alım satım veya diğer türden tavsiye veya öneriler anlamına gelmez ve teşkil etmez. Kullanım Koşulları bölümünde daha fazlasını okuyun.