
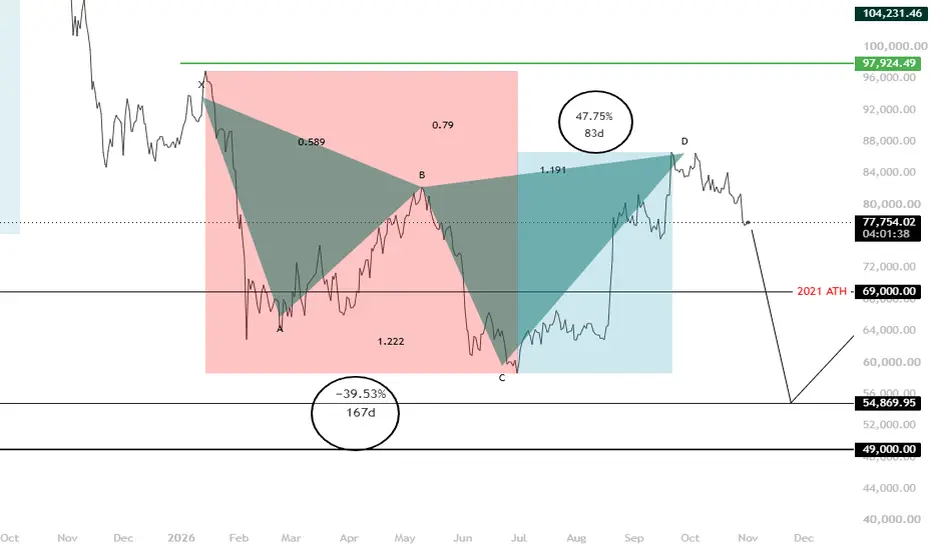
The harmonic pattern shown is a cypher on the Bitcoin weekly timeframe. The chart shown is a daily line chart set on closing price, this is intentional to show the harmony between the sell and buy side.
We have a drop from X to C taking 168 days. The rise in price took 84 days. I will leave you to do the math and work out the relationship.
I believe we see a bigger than expected drop to 54k give or take. I have seen lots of 74k predictions but due to many external factors a sharp drop to 54 seems more in order.
We have a drop from X to C taking 168 days. The rise in price took 84 days. I will leave you to do the math and work out the relationship.
I believe we see a bigger than expected drop to 54k give or take. I have seen lots of 74k predictions but due to many external factors a sharp drop to 54 seems more in order.

Feragatname
Bilgiler ve yayınlar, TradingView tarafından sağlanan veya onaylanan finansal, yatırım, alım satım veya diğer türden tavsiye veya öneriler anlamına gelmez ve teşkil etmez. Kullanım Koşulları bölümünde daha fazlasını okuyun.
Feragatname
Bilgiler ve yayınlar, TradingView tarafından sağlanan veya onaylanan finansal, yatırım, alım satım veya diğer türden tavsiye veya öneriler anlamına gelmez ve teşkil etmez. Kullanım Koşulları bölümünde daha fazlasını okuyun.