Alış
BitShares BTSBTC - Long Setup D1
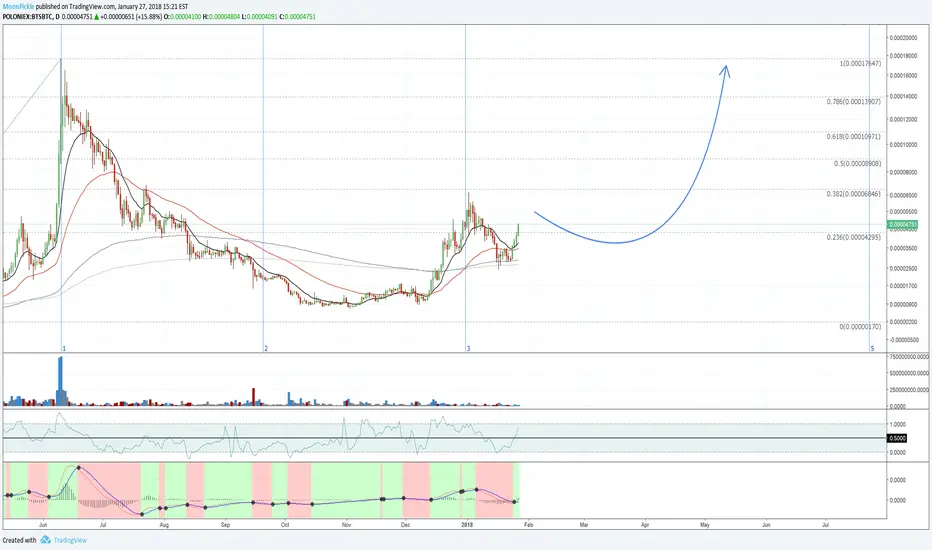
Use fib lines as targets - both time and price analysis are available on the chart.
Measure fib zone 1 to fib zone 2 to determine a time estimate for the formation on the right side of the cup chart pattern within fib zone 3 to fib zone 5.
RSI shows plenty of action on the upper +50 range, indicating bullish bias.
MACD shows fresh momentum.
No volume divergence.
Double bottom pattern shows minor correction is done.
EMA bounce up, no cross.
READY TO GO.
Measure fib zone 1 to fib zone 2 to determine a time estimate for the formation on the right side of the cup chart pattern within fib zone 3 to fib zone 5.
RSI shows plenty of action on the upper +50 range, indicating bullish bias.
MACD shows fresh momentum.
No volume divergence.
Double bottom pattern shows minor correction is done.
EMA bounce up, no cross.
READY TO GO.
İşlem aktif
Not
buy the break out, when price action leaves/breaks the downward channel (moving up)Not
leaving the buy boxNot
BOOMNot
fractals on 4HNot
btc correction took bts with it, a double bottom has appeared on 4HEmir iptal
btc
Feragatname
Bilgiler ve yayınlar, TradingView tarafından sağlanan veya onaylanan finansal, yatırım, alım satım veya diğer türden tavsiye veya öneriler anlamına gelmez ve teşkil etmez. Kullanım Koşulları bölümünde daha fazlasını okuyun.
Feragatname
Bilgiler ve yayınlar, TradingView tarafından sağlanan veya onaylanan finansal, yatırım, alım satım veya diğer türden tavsiye veya öneriler anlamına gelmez ve teşkil etmez. Kullanım Koşulları bölümünde daha fazlasını okuyun.