

Hi Traders
CAD/CHF Multi-Timeframe analysis
H1 CHART ( BULLISH )
A very high probability, entry signal to go LONG was given at 0.71104 after the market found support at 0.70829 . Only the downward break of 0.70829 would cancel the bullish scenario.
Support & Resistances
0.70789 0.71094
0.70455 0.71331
0.70165 0.71621
H4 CHART ( BULLISH )
A very high probability, entry signal to go LONG was given at 0.71104 after the market found support at 0.70829 . Only the downward break of 0.70829 would cancel the bullish scenario.
Support & Resistances
0.70789 0.71094
0.70455 0.71331
0.70293 0.71621
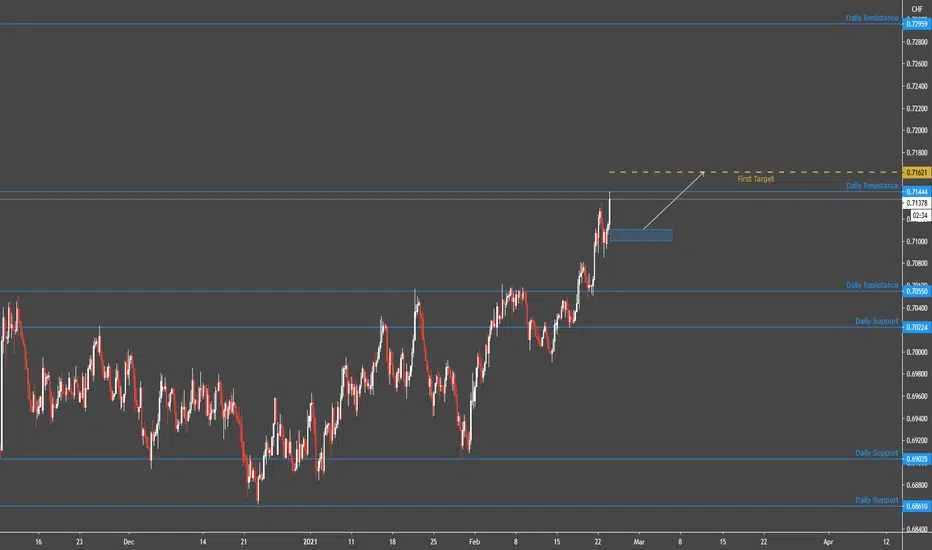
DAILY CHART ( BULLISH )
A medium probability, entry signal to go LONG was given at 0.70611 after the market broke the resistance level at 0.70611 .
Support & Resistances
0.70224 0.70550
0.69035 0.71444
0.68610 0.72959
WEEKLY CHART ( BULLISH )
Waiting for a retracement lower towards the 0.70070 support level, in order to reinstate LONG positions. Next important support is the 0.68165 level.
Support & Resistances
0.70070 0.71194
0.68165 0.72008
0.67449 0.72512
CAD/CHF Multi-Timeframe analysis
H1 CHART ( BULLISH )
A very high probability, entry signal to go LONG was given at 0.71104 after the market found support at 0.70829 . Only the downward break of 0.70829 would cancel the bullish scenario.
Support & Resistances
0.70789 0.71094
0.70455 0.71331
0.70165 0.71621
H4 CHART ( BULLISH )
A very high probability, entry signal to go LONG was given at 0.71104 after the market found support at 0.70829 . Only the downward break of 0.70829 would cancel the bullish scenario.
Support & Resistances
0.70789 0.71094
0.70455 0.71331
0.70293 0.71621
DAILY CHART ( BULLISH )
A medium probability, entry signal to go LONG was given at 0.70611 after the market broke the resistance level at 0.70611 .
Support & Resistances
0.70224 0.70550
0.69035 0.71444
0.68610 0.72959
WEEKLY CHART ( BULLISH )
Waiting for a retracement lower towards the 0.70070 support level, in order to reinstate LONG positions. Next important support is the 0.68165 level.
Support & Resistances
0.70070 0.71194
0.68165 0.72008
0.67449 0.72512

GET MY FREE EDUCATION HERE:
bit.ly/3pQudRX
bit.ly/3pQudRX
Feragatname
Bilgiler ve yayınlar, TradingView tarafından sağlanan veya onaylanan finansal, yatırım, alım satım veya diğer türden tavsiye veya öneriler anlamına gelmez ve teşkil etmez. Kullanım Koşulları bölümünde daha fazlasını okuyun.
GET MY FREE EDUCATION HERE:
bit.ly/3pQudRX
bit.ly/3pQudRX
Feragatname
Bilgiler ve yayınlar, TradingView tarafından sağlanan veya onaylanan finansal, yatırım, alım satım veya diğer türden tavsiye veya öneriler anlamına gelmez ve teşkil etmez. Kullanım Koşulları bölümünde daha fazlasını okuyun.