Alış
CAE - Ascending Triangle Breakout + Re-test
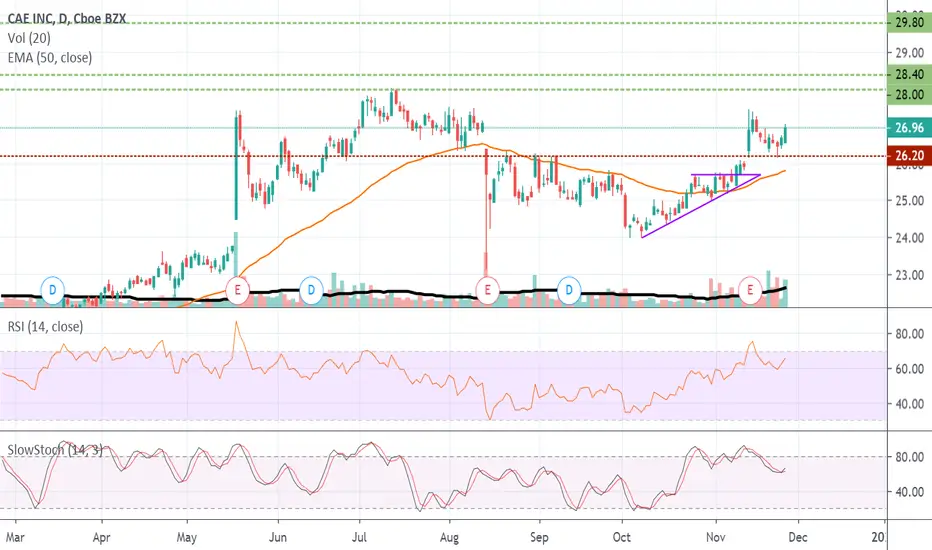
CAE broke out from an Ascending Triangle pattern on November 8th. Since then the price pulled back right to a 50% Fibonacci level where it seems to have found support & is attempting another bullish leg.
I have used the Fibonacci Extension to project three potential price targets at the 50%, 61.8%, & 100% level.
I have used the Fibonacci Extension to project three potential price targets at the 50%, 61.8%, & 100% level.

Feragatname
Bilgiler ve yayınlar, TradingView tarafından sağlanan veya onaylanan finansal, yatırım, alım satım veya diğer türden tavsiye veya öneriler anlamına gelmez ve teşkil etmez. Kullanım Koşulları bölümünde daha fazlasını okuyun.
Feragatname
Bilgiler ve yayınlar, TradingView tarafından sağlanan veya onaylanan finansal, yatırım, alım satım veya diğer türden tavsiye veya öneriler anlamına gelmez ve teşkil etmez. Kullanım Koşulları bölümünde daha fazlasını okuyun.