
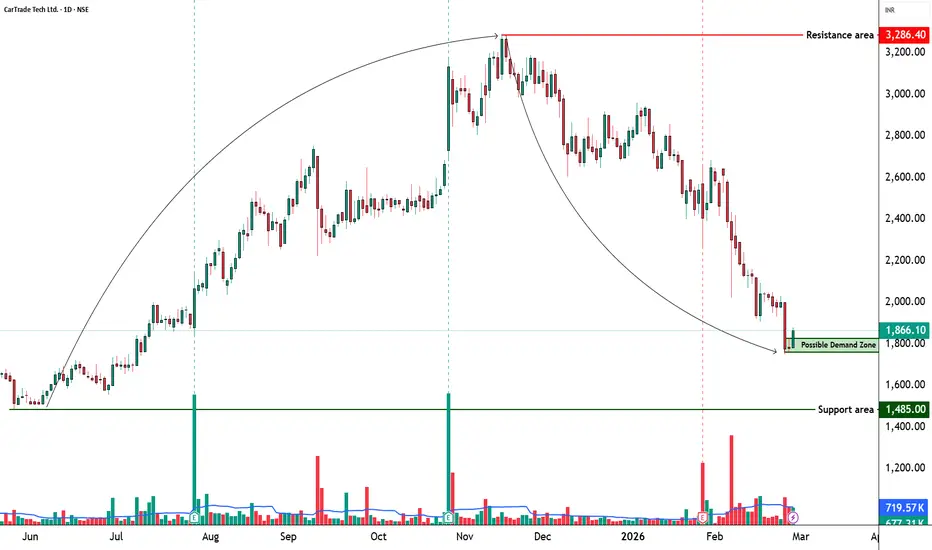
📊 CARTRADE – STWP Equity Snapshot
Ticker: NSE: CARTRADE
Sector: 🚗 Digital Auto Platform / Marketplace
CMP: 1,866.10 ▲ (+4.85% | 26 Feb 2026)
Learning Rating: ⭐⭐⭐☆☆ (Relief Bounce Within Broader Downtrend)
Chart Pattern Observed: 📉 Extended Markdown into Possible Demand Reaction
Candlestick Context: Strong Bullish Reversal Candle from Oversold Zone
📊 Technical Snapshot
CARTRADE has been in a sustained downtrend following distribution near the 3,000 zone, forming a clear sequence of lower highs and lower lows. The recent price action reflects a sharp reaction from the 1,750–1,820 band, where demand absorption appears to be attempting stabilization.
The latest bullish candle indicates responsive buying from a possible demand zone rather than confirmed structural reversal. RSI is positioned near 32.76, reflecting recovery from oversold territory — supportive of short-term bounce potential but not yet signalling broader trend reversal.
Momentum indicators suggest short-term relief strength, but the larger structure remains below prior breakdown levels. From a CPR perspective, price remains below key higher timeframe resistance bands, and continuation requires sustained acceptance above immediate supply clusters.
Structurally, this is currently a range-building attempt within a broader downtrend context. Until price reclaims and sustains above the 1,938–1,998 resistance zone, the recovery remains tactical rather than structural.
📊 Volume Analysis
🔹 Current Volume: Above recent average
🔹 Relative Volume (Vol X): 1.26
💡 Interpretation:
The bounce is supported by above-average participation, suggesting genuine buying response from lower levels. However, continuation strength must be validated by follow-through volume near resistance zones.
🔑 Key Levels – Daily Timeframe
Support Areas: 1,806 | 1,746 | 1,710
Resistance Areas: 1,938 | 1,998 | 2,156
These are zones where price has previously paused, reacted, or reversed.
🔍 Structure Read – What Matters Now
What’s Catching Our Eye:
Sharp rebound from structural demand after extended markdown phase.
What to Watch For:
Acceptance above 1,938–1,998 resistance band.
Failure Zone:
Sustained move below 1,746 support area.
Risks to Watch:
Relief rally failure and continuation of broader downtrend.
What to Expect Next:
Either short-term range expansion toward resistance or consolidation within developing base.
📌 Price Reference Framework – Educational View
🔹 Intraday Reference (Short-Term Observation)
Observation Zone: Around 1,878
Risk Invalidation Area: Below 1,776
Upside Reference Zones: 1,980 → 2,082
Used only to study short-term price behaviour and participation.
🔹 Swing Reference (Positional | 2–5 Sessions)
Observation Zone: Around 1,878
Risk Invalidation Area: Below 1,739
Upside Reference Zones: 2,156 → 2,364
Relevant only if price sustains above reclaimed support and shows continuation acceptance.
🧠 STWP View
Momentum: Moderate
Trend: Range within Broader Downtrend
Risk: High
Volume: Moderate
Sentiment: Neutral
RSI: 32.76 (Recovering from Oversold)
% Change: 4.85%
AI Score: 65/100 | Strength: 3.3/5
📘 Learning Note
Rebounds from oversold zones can be powerful — but structure shifts only when supply is reclaimed with acceptance. Study how price behaves near resistance, not just how it reacts from support.
⚠️ Disclaimer
This post is intended solely for educational and informational purposes. It does not constitute investment advice, a recommendation, or a solicitation to buy or sell any security. Market investments are subject to risk. Please consult a SEBI-registered financial advisor before making any investment decisions. STWP is not responsible for actions taken based on this analysis.
🚀 Stay Calm. Stay Clean. Trade With Patience.
Ticker: NSE: CARTRADE
Sector: 🚗 Digital Auto Platform / Marketplace
CMP: 1,866.10 ▲ (+4.85% | 26 Feb 2026)
Learning Rating: ⭐⭐⭐☆☆ (Relief Bounce Within Broader Downtrend)
Chart Pattern Observed: 📉 Extended Markdown into Possible Demand Reaction
Candlestick Context: Strong Bullish Reversal Candle from Oversold Zone
📊 Technical Snapshot
CARTRADE has been in a sustained downtrend following distribution near the 3,000 zone, forming a clear sequence of lower highs and lower lows. The recent price action reflects a sharp reaction from the 1,750–1,820 band, where demand absorption appears to be attempting stabilization.
The latest bullish candle indicates responsive buying from a possible demand zone rather than confirmed structural reversal. RSI is positioned near 32.76, reflecting recovery from oversold territory — supportive of short-term bounce potential but not yet signalling broader trend reversal.
Momentum indicators suggest short-term relief strength, but the larger structure remains below prior breakdown levels. From a CPR perspective, price remains below key higher timeframe resistance bands, and continuation requires sustained acceptance above immediate supply clusters.
Structurally, this is currently a range-building attempt within a broader downtrend context. Until price reclaims and sustains above the 1,938–1,998 resistance zone, the recovery remains tactical rather than structural.
📊 Volume Analysis
🔹 Current Volume: Above recent average
🔹 Relative Volume (Vol X): 1.26
💡 Interpretation:
The bounce is supported by above-average participation, suggesting genuine buying response from lower levels. However, continuation strength must be validated by follow-through volume near resistance zones.
🔑 Key Levels – Daily Timeframe
Support Areas: 1,806 | 1,746 | 1,710
Resistance Areas: 1,938 | 1,998 | 2,156
These are zones where price has previously paused, reacted, or reversed.
🔍 Structure Read – What Matters Now
What’s Catching Our Eye:
Sharp rebound from structural demand after extended markdown phase.
What to Watch For:
Acceptance above 1,938–1,998 resistance band.
Failure Zone:
Sustained move below 1,746 support area.
Risks to Watch:
Relief rally failure and continuation of broader downtrend.
What to Expect Next:
Either short-term range expansion toward resistance or consolidation within developing base.
📌 Price Reference Framework – Educational View
🔹 Intraday Reference (Short-Term Observation)
Observation Zone: Around 1,878
Risk Invalidation Area: Below 1,776
Upside Reference Zones: 1,980 → 2,082
Used only to study short-term price behaviour and participation.
🔹 Swing Reference (Positional | 2–5 Sessions)
Observation Zone: Around 1,878
Risk Invalidation Area: Below 1,739
Upside Reference Zones: 2,156 → 2,364
Relevant only if price sustains above reclaimed support and shows continuation acceptance.
🧠 STWP View
Momentum: Moderate
Trend: Range within Broader Downtrend
Risk: High
Volume: Moderate
Sentiment: Neutral
RSI: 32.76 (Recovering from Oversold)
% Change: 4.85%
AI Score: 65/100 | Strength: 3.3/5
📘 Learning Note
Rebounds from oversold zones can be powerful — but structure shifts only when supply is reclaimed with acceptance. Study how price behaves near resistance, not just how it reacts from support.
⚠️ Disclaimer
This post is intended solely for educational and informational purposes. It does not constitute investment advice, a recommendation, or a solicitation to buy or sell any security. Market investments are subject to risk. Please consult a SEBI-registered financial advisor before making any investment decisions. STWP is not responsible for actions taken based on this analysis.
🚀 Stay Calm. Stay Clean. Trade With Patience.

STWP | Mentor & Demand-Supply Specialist |
Empowering traders through structured learning |
simpletradewithpatience.com
Community: chat.whatsapp.com/BEYz0tkqP0fJPBCWf59uel
wa.me/message/6IOPHGOXMGZ4N1
Educational Only
Empowering traders through structured learning |
simpletradewithpatience.com
Community: chat.whatsapp.com/BEYz0tkqP0fJPBCWf59uel
wa.me/message/6IOPHGOXMGZ4N1
Educational Only
Feragatname
Bilgiler ve yayınlar, TradingView tarafından sağlanan veya onaylanan finansal, yatırım, alım satım veya diğer türden tavsiye veya öneriler anlamına gelmez ve teşkil etmez. Kullanım Koşulları bölümünde daha fazlasını okuyun.
STWP | Mentor & Demand-Supply Specialist |
Empowering traders through structured learning |
simpletradewithpatience.com
Community: chat.whatsapp.com/BEYz0tkqP0fJPBCWf59uel
wa.me/message/6IOPHGOXMGZ4N1
Educational Only
Empowering traders through structured learning |
simpletradewithpatience.com
Community: chat.whatsapp.com/BEYz0tkqP0fJPBCWf59uel
wa.me/message/6IOPHGOXMGZ4N1
Educational Only
Feragatname
Bilgiler ve yayınlar, TradingView tarafından sağlanan veya onaylanan finansal, yatırım, alım satım veya diğer türden tavsiye veya öneriler anlamına gelmez ve teşkil etmez. Kullanım Koşulları bölümünde daha fazlasını okuyun.