Alış
CCCS - Buy
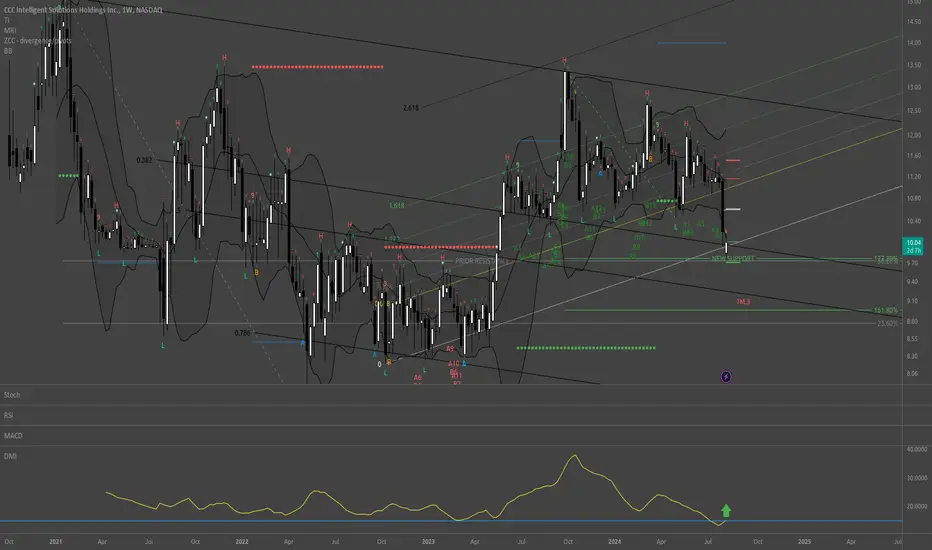
I used TradingView's stock screener to find assets with ADX (14) crossing up 15 on Weekly charts and came upon this CCCS. All of this analysis is based on a Weekly chart. First and foremost this is the first time that ADX is crossing up 15 in the chart's history. Secondly, TD Sequential is on 8/9 of a Buy signal. Third, it's at the bottom of the Bollinger Band. Fourthly, it's at Fibonacci Pivots S2. Lastly, this exact spot is a convergence of several Fibonacci support levels. This looks like the bottom of a coming up trend.
38.20% pullback into Monthly Fibonacci Pivots S2:

38.20% pullback:

127.20% extension support:

Uptrend neared 2.618% extension:

ADX crossing up 15 first time in stock's history:

Bollinger Band lower band:

38.20% pullback into Monthly Fibonacci Pivots S2:
38.20% pullback:
127.20% extension support:
Uptrend neared 2.618% extension:
ADX crossing up 15 first time in stock's history:
Bollinger Band lower band:

İlgili yayınlar
Feragatname
Bilgiler ve yayınlar, TradingView tarafından sağlanan veya onaylanan finansal, yatırım, alım satım veya diğer türden tavsiye veya öneriler anlamına gelmez ve teşkil etmez. Kullanım Koşulları bölümünde daha fazlasını okuyun.
İlgili yayınlar
Feragatname
Bilgiler ve yayınlar, TradingView tarafından sağlanan veya onaylanan finansal, yatırım, alım satım veya diğer türden tavsiye veya öneriler anlamına gelmez ve teşkil etmez. Kullanım Koşulları bölümünde daha fazlasını okuyun.