
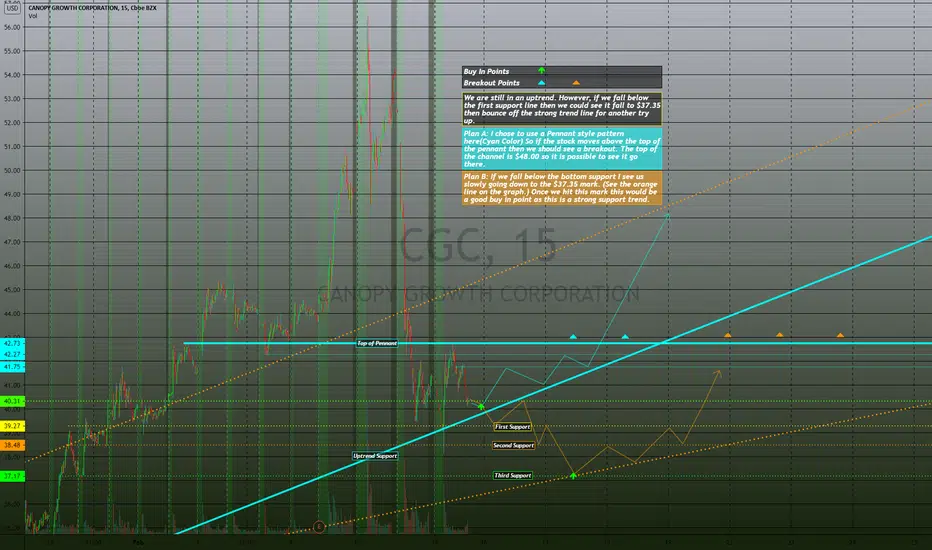
We are still in an uptrend. However, if we fall below the first support line then we could see it fall to $37.35 then bounce off the strong trend line for another try up.
Plan A: I chose to use a Pennant style pattern here(Cyan Color) So if the stock moves above the top of the pennant then we should see a breakout. The top of the channel is $48.00 so it is possible to see it go there.
Plan B: If we fall below the bottom support I see us slowly going down to the $37.35 mark. (See the orange line on the graph.) Once we hit this mark this would be a good buy in point as this is a strong support trend.
Plan A: I chose to use a Pennant style pattern here(Cyan Color) So if the stock moves above the top of the pennant then we should see a breakout. The top of the channel is $48.00 so it is possible to see it go there.
Plan B: If we fall below the bottom support I see us slowly going down to the $37.35 mark. (See the orange line on the graph.) Once we hit this mark this would be a good buy in point as this is a strong support trend.

Feragatname
Bilgiler ve yayınlar, TradingView tarafından sağlanan veya onaylanan finansal, yatırım, alım satım veya diğer türden tavsiye veya öneriler anlamına gelmez ve teşkil etmez. Kullanım Koşulları bölümünde daha fazlasını okuyun.
Feragatname
Bilgiler ve yayınlar, TradingView tarafından sağlanan veya onaylanan finansal, yatırım, alım satım veya diğer türden tavsiye veya öneriler anlamına gelmez ve teşkil etmez. Kullanım Koşulları bölümünde daha fazlasını okuyun.