
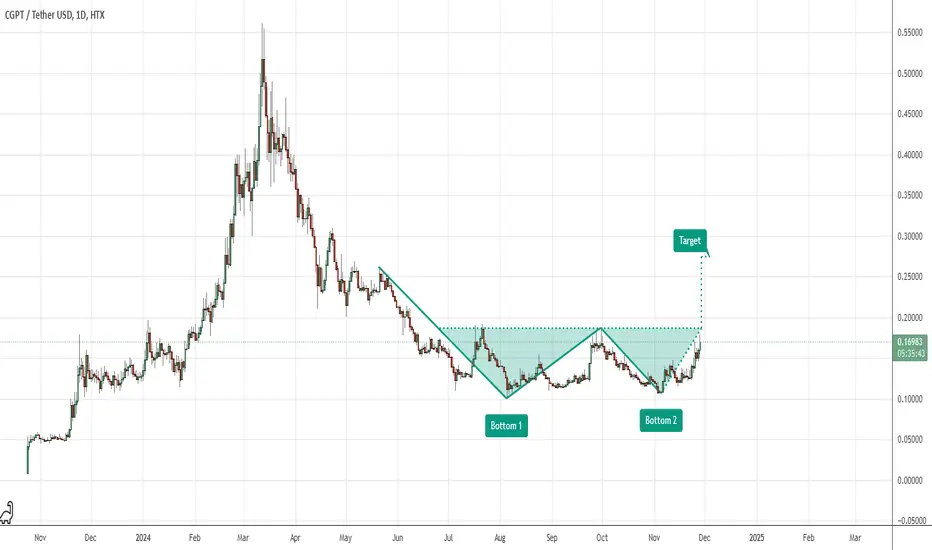
The chart depicts a double-bottom pattern, signaling a potential bullish reversal. The breakout above the neckline (~$0.17) confirms the pattern, with a target projected near $0.30 based on the height of the formation. Strong support lies at $0.15, while resistance levels exist around $0.22 and $0.25. Sustained momentum could achieve the target.

Feragatname
Bilgiler ve yayınlar, TradingView tarafından sağlanan veya onaylanan finansal, yatırım, alım satım veya diğer türden tavsiye veya öneriler anlamına gelmez ve teşkil etmez. Kullanım Koşulları bölümünde daha fazlasını okuyun.
Feragatname
Bilgiler ve yayınlar, TradingView tarafından sağlanan veya onaylanan finansal, yatırım, alım satım veya diğer türden tavsiye veya öneriler anlamına gelmez ve teşkil etmez. Kullanım Koşulları bölümünde daha fazlasını okuyun.