
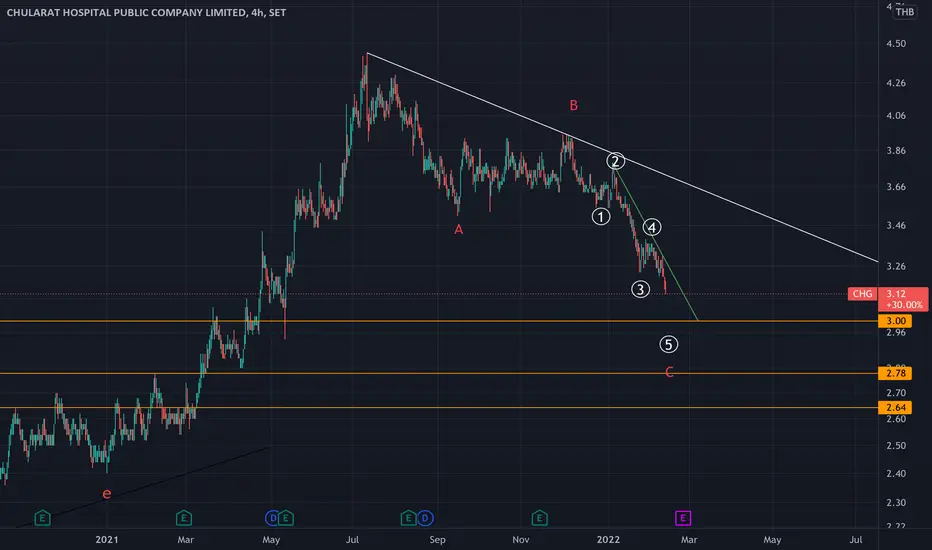
- Price is most likely an ABC correction, with the red wave C being an impulse and consisting of 5 segments - 12345.
- Support levels are shown on the chart.
- To confirm the end of this correction - 1. price breaks the green trendline 2. price breaks the white trendline.
- Support levels are shown on the chart.
- To confirm the end of this correction - 1. price breaks the green trendline 2. price breaks the white trendline.

Feragatname
Bilgiler ve yayınlar, TradingView tarafından sağlanan veya onaylanan finansal, yatırım, alım satım veya diğer türden tavsiye veya öneriler anlamına gelmez ve teşkil etmez. Kullanım Koşulları bölümünde daha fazlasını okuyun.
Feragatname
Bilgiler ve yayınlar, TradingView tarafından sağlanan veya onaylanan finansal, yatırım, alım satım veya diğer türden tavsiye veya öneriler anlamına gelmez ve teşkil etmez. Kullanım Koşulları bölümünde daha fazlasını okuyun.