
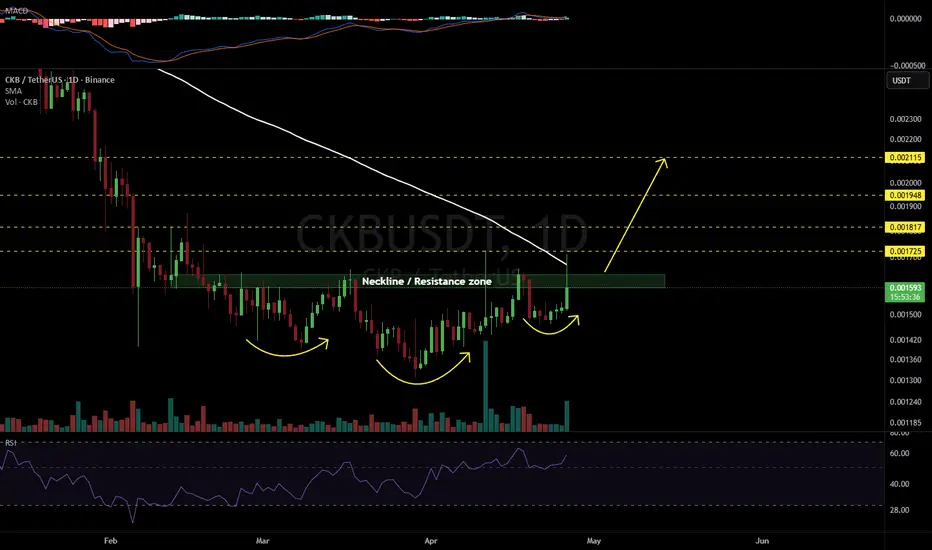
#CKB has formed an inverse head & shoulders pattern on the daily chart. In case of a breakout above the neckline and the daily SMA100, the potential upside targets are:
🎯 $0.001725
🎯 $0.001817
🎯 $0.001948
🎯 $0.002115
⚠️ Always remember to use tight stop-losses and maintain proper risk management.
🎯 $0.001725
🎯 $0.001817
🎯 $0.001948
🎯 $0.002115
⚠️ Always remember to use tight stop-losses and maintain proper risk management.

Feragatname
Bilgiler ve yayınlar, TradingView tarafından sağlanan veya onaylanan finansal, yatırım, alım satım veya diğer türden tavsiye veya öneriler anlamına gelmez ve teşkil etmez. Kullanım Koşulları bölümünde daha fazlasını okuyun.
Feragatname
Bilgiler ve yayınlar, TradingView tarafından sağlanan veya onaylanan finansal, yatırım, alım satım veya diğer türden tavsiye veya öneriler anlamına gelmez ve teşkil etmez. Kullanım Koşulları bölümünde daha fazlasını okuyun.